Immigrants from Canada vs Delaware 1 or more Vehicles in Household
COMPARE
Immigrants from Canada
Delaware
1 or more Vehicles in Household
1 or more Vehicles in Household Comparison
Immigrants from Canada
Delaware
91.4%
1 OR MORE VEHICLES IN HOUSEHOLD
99.2/ 100
METRIC RATING
90th/ 347
METRIC RANK
91.0%
1 OR MORE VEHICLES IN HOUSEHOLD
97.6/ 100
METRIC RATING
109th/ 347
METRIC RANK
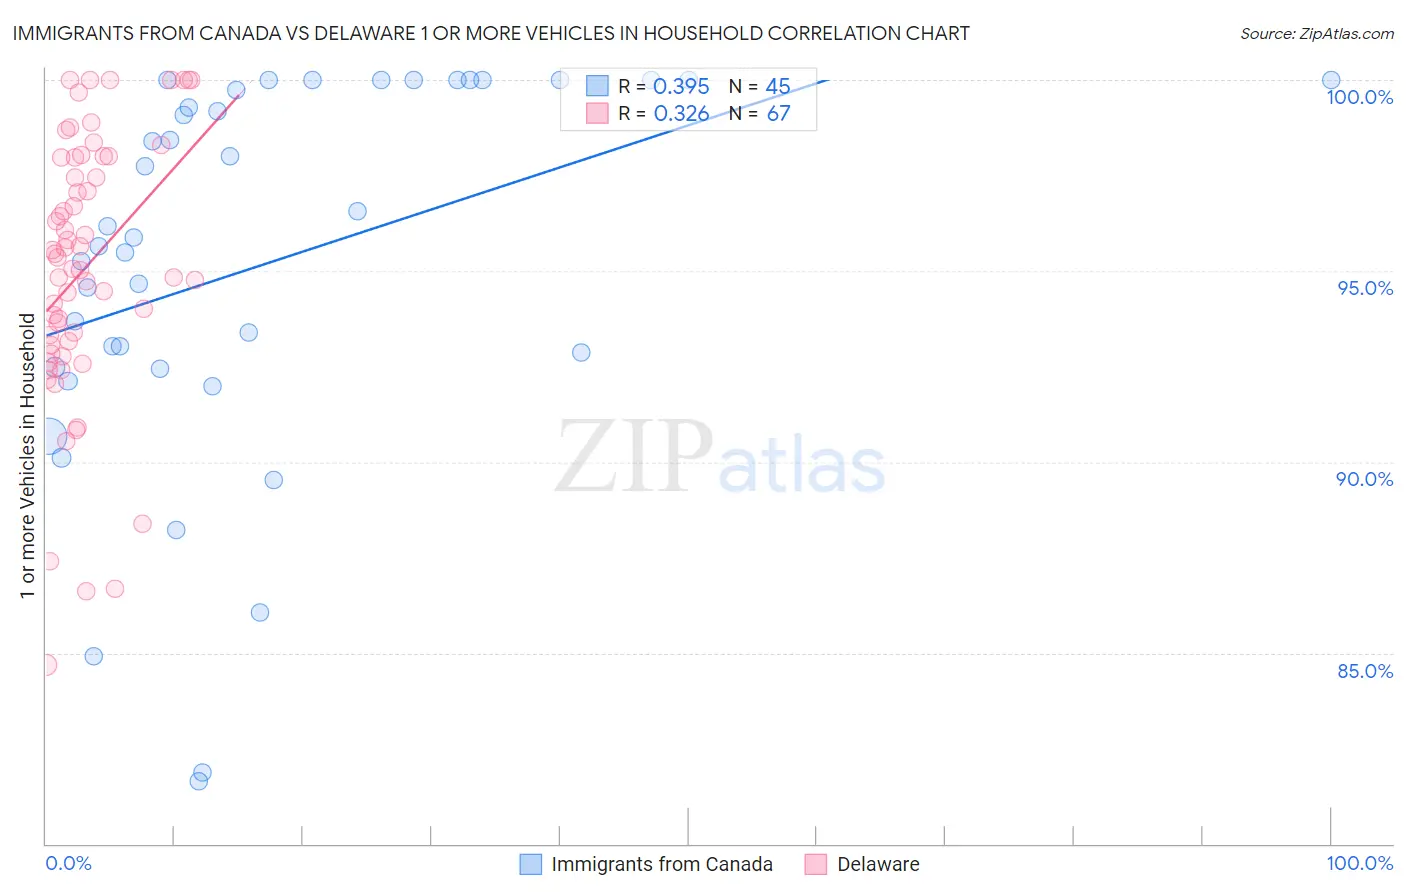
Immigrants from Canada vs Delaware 1 or more Vehicles in Household Correlation Chart
The statistical analysis conducted on geographies consisting of 459,177,066 people shows a mild positive correlation between the proportion of Immigrants from Canada and percentage of households with 1 or more vehicles available in the United States with a correlation coefficient (R) of 0.395 and weighted average of 91.4%. Similarly, the statistical analysis conducted on geographies consisting of 96,231,317 people shows a mild positive correlation between the proportion of Delaware and percentage of households with 1 or more vehicles available in the United States with a correlation coefficient (R) of 0.326 and weighted average of 91.0%, a difference of 0.43%.
1 or more Vehicles in Household Correlation Summary
| Measurement | Immigrants from Canada | Delaware |
| Minimum | 81.6% | 84.7% |
| Maximum | 100.0% | 100.0% |
| Range | 18.4% | 15.3% |
| Mean | 95.2% | 95.1% |
| Median | 95.9% | 95.4% |
| Interquartile 25% (IQ1) | 92.5% | 93.1% |
| Interquartile 75% (IQ3) | 100.0% | 98.0% |
| Interquartile Range (IQR) | 7.5% | 4.9% |
| Standard Deviation (Sample) | 5.0% | 3.5% |
| Standard Deviation (Population) | 5.0% | 3.5% |
Demographics Similar to Immigrants from Canada and Delaware by 1 or more Vehicles in Household
In terms of 1 or more vehicles in household, the demographic groups most similar to Immigrants from Canada are Bangladeshi (91.4%, a difference of 0.0%), Immigrants from Jordan (91.4%, a difference of 0.0%), Bhutanese (91.4%, a difference of 0.010%), Immigrants from North America (91.4%, a difference of 0.010%), and Immigrants from Cuba (91.3%, a difference of 0.070%). Similarly, the demographic groups most similar to Delaware are Hispanic or Latino (91.0%, a difference of 0.0%), Maltese (91.0%, a difference of 0.010%), Zimbabwean (91.0%, a difference of 0.020%), Laotian (91.0%, a difference of 0.070%), and Asian (91.1%, a difference of 0.11%).
| Demographics | Rating | Rank | 1 or more Vehicles in Household |
| Bangladeshis | 99.2 /100 | #89 | Exceptional 91.4% |
| Immigrants | Canada | 99.2 /100 | #90 | Exceptional 91.4% |
| Immigrants | Jordan | 99.2 /100 | #91 | Exceptional 91.4% |
| Bhutanese | 99.2 /100 | #92 | Exceptional 91.4% |
| Immigrants | North America | 99.2 /100 | #93 | Exceptional 91.4% |
| Immigrants | Cuba | 99.1 /100 | #94 | Exceptional 91.3% |
| Austrians | 99.0 /100 | #95 | Exceptional 91.3% |
| Potawatomi | 99.0 /100 | #96 | Exceptional 91.3% |
| Pakistanis | 99.0 /100 | #97 | Exceptional 91.3% |
| Slavs | 98.7 /100 | #98 | Exceptional 91.2% |
| Immigrants | Bolivia | 98.6 /100 | #99 | Exceptional 91.2% |
| Immigrants | Central America | 98.4 /100 | #100 | Exceptional 91.1% |
| Bulgarians | 98.4 /100 | #101 | Exceptional 91.1% |
| Seminole | 98.3 /100 | #102 | Exceptional 91.1% |
| Yugoslavians | 98.3 /100 | #103 | Exceptional 91.1% |
| Asians | 98.2 /100 | #104 | Exceptional 91.1% |
| Laotians | 98.0 /100 | #105 | Exceptional 91.0% |
| Zimbabweans | 97.7 /100 | #106 | Exceptional 91.0% |
| Maltese | 97.7 /100 | #107 | Exceptional 91.0% |
| Hispanics or Latinos | 97.6 /100 | #108 | Exceptional 91.0% |
| Delaware | 97.6 /100 | #109 | Exceptional 91.0% |