Immigrants from Trinidad and Tobago vs Delaware 1 or more Vehicles in Household
COMPARE
Immigrants from Trinidad and Tobago
Delaware
1 or more Vehicles in Household
1 or more Vehicles in Household Comparison
Immigrants from Trinidad and Tobago
Delaware
76.8%
1 OR MORE VEHICLES IN HOUSEHOLD
0.0/ 100
METRIC RATING
330th/ 347
METRIC RANK
91.0%
1 OR MORE VEHICLES IN HOUSEHOLD
97.6/ 100
METRIC RATING
109th/ 347
METRIC RANK
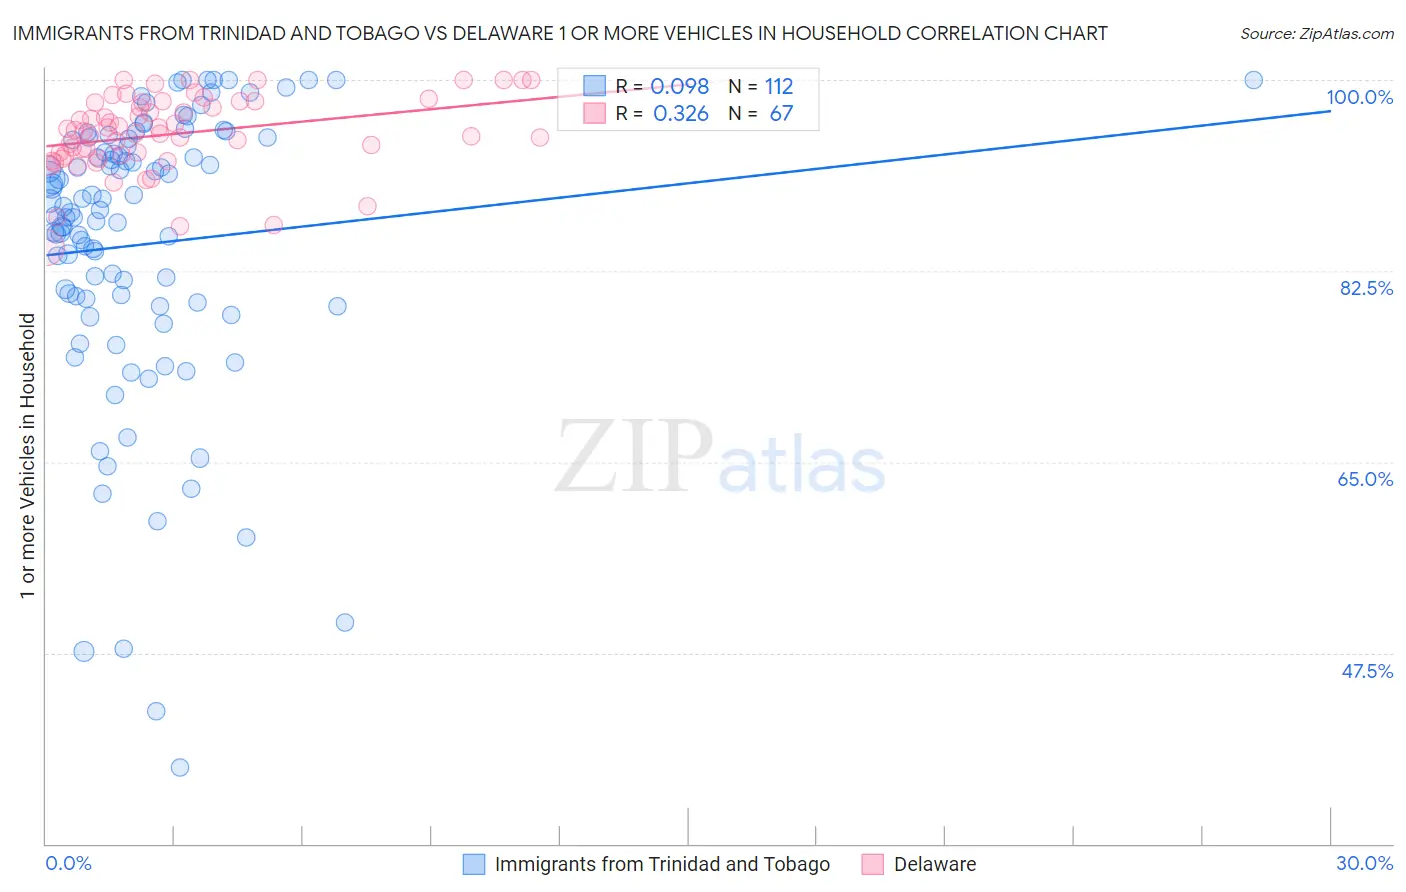
Immigrants from Trinidad and Tobago vs Delaware 1 or more Vehicles in Household Correlation Chart
The statistical analysis conducted on geographies consisting of 223,174,280 people shows a slight positive correlation between the proportion of Immigrants from Trinidad and Tobago and percentage of households with 1 or more vehicles available in the United States with a correlation coefficient (R) of 0.098 and weighted average of 76.8%. Similarly, the statistical analysis conducted on geographies consisting of 96,231,317 people shows a mild positive correlation between the proportion of Delaware and percentage of households with 1 or more vehicles available in the United States with a correlation coefficient (R) of 0.326 and weighted average of 91.0%, a difference of 18.5%.
1 or more Vehicles in Household Correlation Summary
| Measurement | Immigrants from Trinidad and Tobago | Delaware |
| Minimum | 37.0% | 84.7% |
| Maximum | 100.0% | 100.0% |
| Range | 63.0% | 15.3% |
| Mean | 84.9% | 95.1% |
| Median | 88.0% | 95.4% |
| Interquartile 25% (IQ1) | 79.7% | 93.1% |
| Interquartile 75% (IQ3) | 94.2% | 98.0% |
| Interquartile Range (IQR) | 14.5% | 4.9% |
| Standard Deviation (Sample) | 13.1% | 3.5% |
| Standard Deviation (Population) | 13.1% | 3.5% |
Similar Demographics by 1 or more Vehicles in Household
Demographics Similar to Immigrants from Trinidad and Tobago by 1 or more Vehicles in Household
In terms of 1 or more vehicles in household, the demographic groups most similar to Immigrants from Trinidad and Tobago are West Indian (76.4%, a difference of 0.55%), Trinidadian and Tobagonian (76.3%, a difference of 0.64%), Immigrants from Ecuador (76.2%, a difference of 0.73%), Immigrants from Dominica (77.8%, a difference of 1.4%), and Ecuadorian (77.9%, a difference of 1.5%).
| Demographics | Rating | Rank | 1 or more Vehicles in Household |
| Immigrants | Yemen | 0.0 /100 | #323 | Tragic 80.5% |
| Immigrants | Caribbean | 0.0 /100 | #324 | Tragic 80.4% |
| Senegalese | 0.0 /100 | #325 | Tragic 80.4% |
| Immigrants | West Indies | 0.0 /100 | #326 | Tragic 79.5% |
| Immigrants | Senegal | 0.0 /100 | #327 | Tragic 79.0% |
| Ecuadorians | 0.0 /100 | #328 | Tragic 77.9% |
| Immigrants | Dominica | 0.0 /100 | #329 | Tragic 77.8% |
| Immigrants | Trinidad and Tobago | 0.0 /100 | #330 | Tragic 76.8% |
| West Indians | 0.0 /100 | #331 | Tragic 76.4% |
| Trinidadians and Tobagonians | 0.0 /100 | #332 | Tragic 76.3% |
| Immigrants | Ecuador | 0.0 /100 | #333 | Tragic 76.2% |
| Immigrants | Bangladesh | 0.0 /100 | #334 | Tragic 74.3% |
| Barbadians | 0.0 /100 | #335 | Tragic 74.0% |
| Vietnamese | 0.0 /100 | #336 | Tragic 73.8% |
| Immigrants | Uzbekistan | 0.0 /100 | #337 | Tragic 73.4% |
Demographics Similar to Delaware by 1 or more Vehicles in Household
In terms of 1 or more vehicles in household, the demographic groups most similar to Delaware are Hispanic or Latino (91.0%, a difference of 0.0%), Maltese (91.0%, a difference of 0.010%), Zimbabwean (91.0%, a difference of 0.020%), Mexican American Indian (91.0%, a difference of 0.030%), and Laotian (91.0%, a difference of 0.070%).
| Demographics | Rating | Rank | 1 or more Vehicles in Household |
| Seminole | 98.3 /100 | #102 | Exceptional 91.1% |
| Yugoslavians | 98.3 /100 | #103 | Exceptional 91.1% |
| Asians | 98.2 /100 | #104 | Exceptional 91.1% |
| Laotians | 98.0 /100 | #105 | Exceptional 91.0% |
| Zimbabweans | 97.7 /100 | #106 | Exceptional 91.0% |
| Maltese | 97.7 /100 | #107 | Exceptional 91.0% |
| Hispanics or Latinos | 97.6 /100 | #108 | Exceptional 91.0% |
| Delaware | 97.6 /100 | #109 | Exceptional 91.0% |
| Mexican American Indians | 97.4 /100 | #110 | Exceptional 91.0% |
| Navajo | 95.8 /100 | #111 | Exceptional 90.8% |
| Immigrants | Netherlands | 95.7 /100 | #112 | Exceptional 90.8% |
| Immigrants | Kuwait | 94.7 /100 | #113 | Exceptional 90.7% |
| Armenians | 94.5 /100 | #114 | Exceptional 90.7% |
| Serbians | 94.3 /100 | #115 | Exceptional 90.7% |
| Chippewa | 94.3 /100 | #116 | Exceptional 90.7% |