Chickasaw vs Delaware 1 or more Vehicles in Household
COMPARE
Chickasaw
Delaware
1 or more Vehicles in Household
1 or more Vehicles in Household Comparison
Chickasaw
Delaware
92.3%
1 OR MORE VEHICLES IN HOUSEHOLD
99.9/ 100
METRIC RATING
42nd/ 347
METRIC RANK
91.0%
1 OR MORE VEHICLES IN HOUSEHOLD
97.6/ 100
METRIC RATING
109th/ 347
METRIC RANK
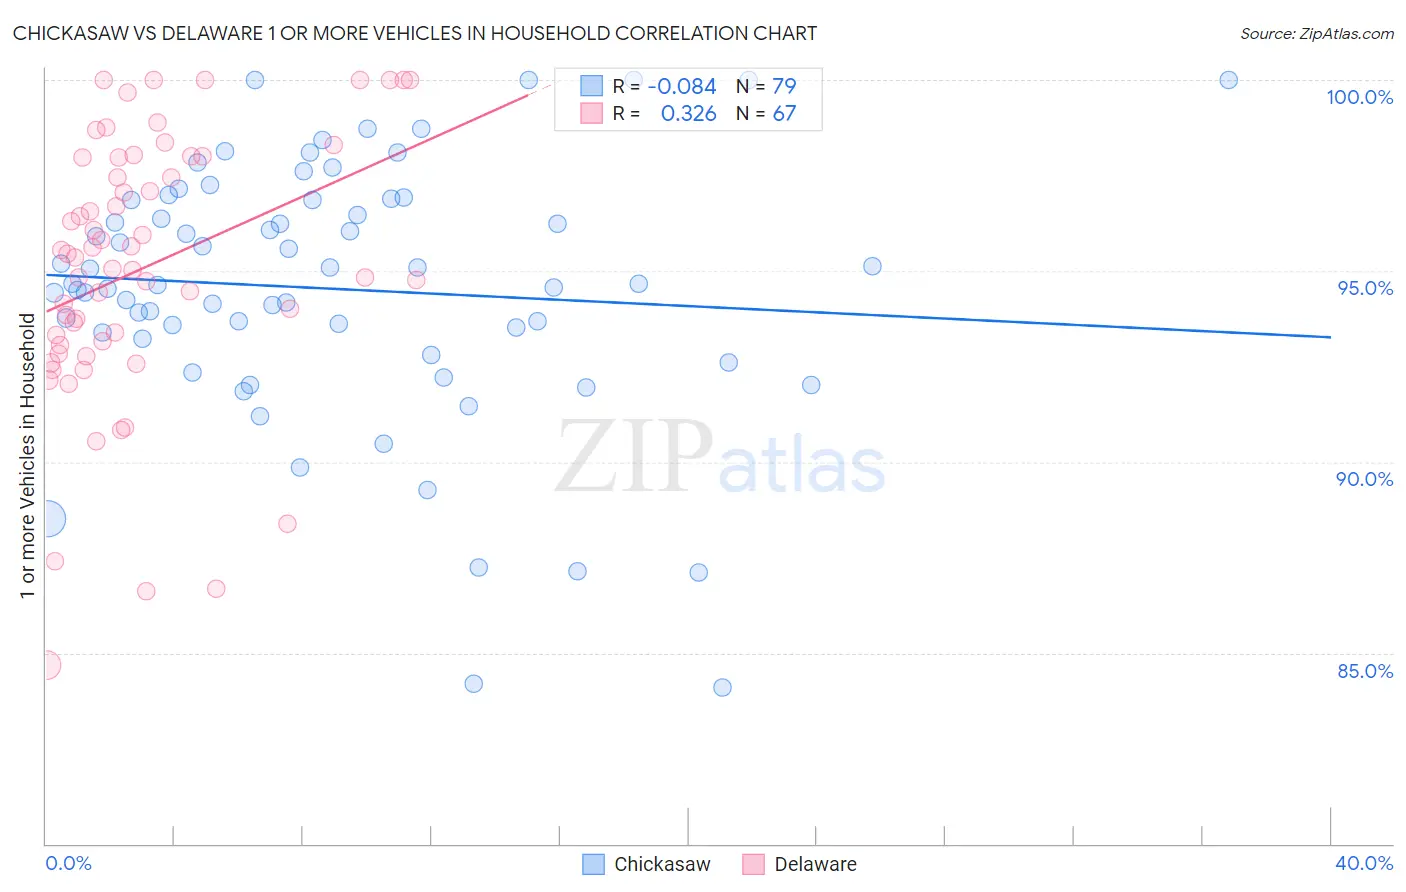
Chickasaw vs Delaware 1 or more Vehicles in Household Correlation Chart
The statistical analysis conducted on geographies consisting of 147,674,268 people shows a slight negative correlation between the proportion of Chickasaw and percentage of households with 1 or more vehicles available in the United States with a correlation coefficient (R) of -0.084 and weighted average of 92.3%. Similarly, the statistical analysis conducted on geographies consisting of 96,231,317 people shows a mild positive correlation between the proportion of Delaware and percentage of households with 1 or more vehicles available in the United States with a correlation coefficient (R) of 0.326 and weighted average of 91.0%, a difference of 1.4%.
1 or more Vehicles in Household Correlation Summary
| Measurement | Chickasaw | Delaware |
| Minimum | 84.1% | 84.7% |
| Maximum | 100.0% | 100.0% |
| Range | 15.9% | 15.3% |
| Mean | 94.5% | 95.1% |
| Median | 94.7% | 95.4% |
| Interquartile 25% (IQ1) | 93.2% | 93.1% |
| Interquartile 75% (IQ3) | 96.8% | 98.0% |
| Interquartile Range (IQR) | 3.6% | 4.9% |
| Standard Deviation (Sample) | 3.4% | 3.5% |
| Standard Deviation (Population) | 3.4% | 3.5% |
Similar Demographics by 1 or more Vehicles in Household
Demographics Similar to Chickasaw by 1 or more Vehicles in Household
In terms of 1 or more vehicles in household, the demographic groups most similar to Chickasaw are Spanish (92.3%, a difference of 0.0%), Immigrants from Taiwan (92.3%, a difference of 0.010%), Choctaw (92.2%, a difference of 0.020%), Swiss (92.3%, a difference of 0.030%), and Creek (92.3%, a difference of 0.030%).
| Demographics | Rating | Rank | 1 or more Vehicles in Household |
| Czechoslovakians | 99.9 /100 | #35 | Exceptional 92.3% |
| Malaysians | 99.9 /100 | #36 | Exceptional 92.3% |
| French Canadians | 99.9 /100 | #37 | Exceptional 92.3% |
| Immigrants | Vietnam | 99.9 /100 | #38 | Exceptional 92.3% |
| Swiss | 99.9 /100 | #39 | Exceptional 92.3% |
| Creek | 99.9 /100 | #40 | Exceptional 92.3% |
| Immigrants | Taiwan | 99.9 /100 | #41 | Exceptional 92.3% |
| Chickasaw | 99.9 /100 | #42 | Exceptional 92.3% |
| Spanish | 99.9 /100 | #43 | Exceptional 92.3% |
| Choctaw | 99.9 /100 | #44 | Exceptional 92.2% |
| Immigrants | Nonimmigrants | 99.9 /100 | #45 | Exceptional 92.2% |
| Immigrants | Fiji | 99.9 /100 | #46 | Exceptional 92.2% |
| Northern Europeans | 99.9 /100 | #47 | Exceptional 92.2% |
| Belgians | 99.9 /100 | #48 | Exceptional 92.1% |
| Afghans | 99.9 /100 | #49 | Exceptional 92.1% |
Demographics Similar to Delaware by 1 or more Vehicles in Household
In terms of 1 or more vehicles in household, the demographic groups most similar to Delaware are Hispanic or Latino (91.0%, a difference of 0.0%), Maltese (91.0%, a difference of 0.010%), Zimbabwean (91.0%, a difference of 0.020%), Mexican American Indian (91.0%, a difference of 0.030%), and Laotian (91.0%, a difference of 0.070%).
| Demographics | Rating | Rank | 1 or more Vehicles in Household |
| Seminole | 98.3 /100 | #102 | Exceptional 91.1% |
| Yugoslavians | 98.3 /100 | #103 | Exceptional 91.1% |
| Asians | 98.2 /100 | #104 | Exceptional 91.1% |
| Laotians | 98.0 /100 | #105 | Exceptional 91.0% |
| Zimbabweans | 97.7 /100 | #106 | Exceptional 91.0% |
| Maltese | 97.7 /100 | #107 | Exceptional 91.0% |
| Hispanics or Latinos | 97.6 /100 | #108 | Exceptional 91.0% |
| Delaware | 97.6 /100 | #109 | Exceptional 91.0% |
| Mexican American Indians | 97.4 /100 | #110 | Exceptional 91.0% |
| Navajo | 95.8 /100 | #111 | Exceptional 90.8% |
| Immigrants | Netherlands | 95.7 /100 | #112 | Exceptional 90.8% |
| Immigrants | Kuwait | 94.7 /100 | #113 | Exceptional 90.7% |
| Armenians | 94.5 /100 | #114 | Exceptional 90.7% |
| Serbians | 94.3 /100 | #115 | Exceptional 90.7% |
| Chippewa | 94.3 /100 | #116 | Exceptional 90.7% |