Immigrants from Jordan vs Costa Rican Single Mother Households
COMPARE
Immigrants from Jordan
Costa Rican
Single Mother Households
Single Mother Households Comparison
Immigrants from Jordan
Costa Ricans
6.0%
SINGLE MOTHER HOUSEHOLDS
82.3/ 100
METRIC RATING
147th/ 347
METRIC RANK
6.5%
SINGLE MOTHER HOUSEHOLDS
24.8/ 100
METRIC RATING
186th/ 347
METRIC RANK
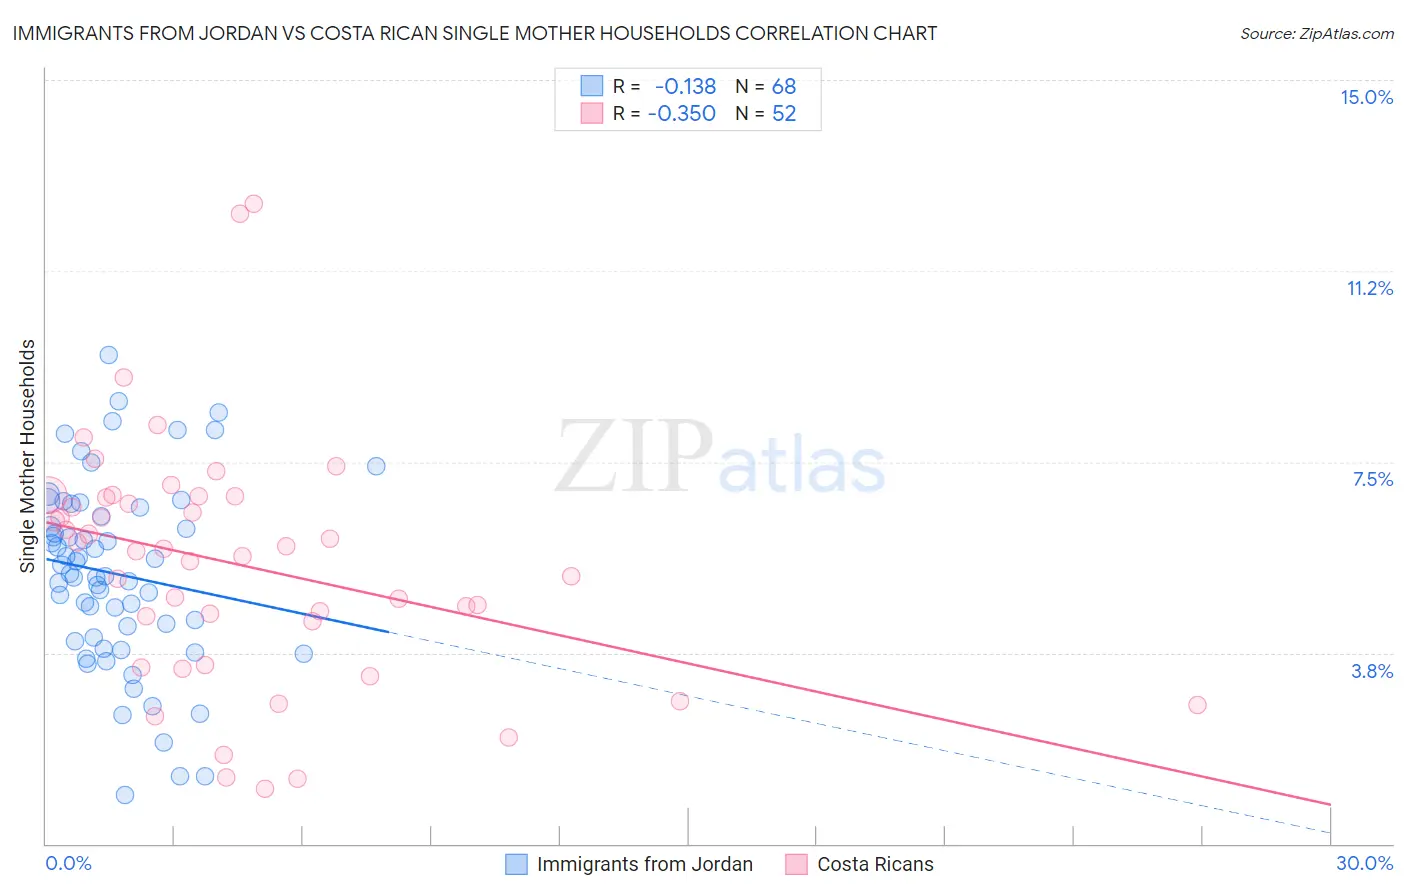
Immigrants from Jordan vs Costa Rican Single Mother Households Correlation Chart
The statistical analysis conducted on geographies consisting of 181,167,128 people shows a poor negative correlation between the proportion of Immigrants from Jordan and percentage of single mother households in the United States with a correlation coefficient (R) of -0.138 and weighted average of 6.0%. Similarly, the statistical analysis conducted on geographies consisting of 253,167,029 people shows a mild negative correlation between the proportion of Costa Ricans and percentage of single mother households in the United States with a correlation coefficient (R) of -0.350 and weighted average of 6.5%, a difference of 7.5%.
Single Mother Households Correlation Summary
| Measurement | Immigrants from Jordan | Costa Rican |
| Minimum | 0.95% | 1.1% |
| Maximum | 9.6% | 12.6% |
| Range | 8.7% | 11.5% |
| Mean | 5.3% | 5.5% |
| Median | 5.3% | 5.8% |
| Interquartile 25% (IQ1) | 4.0% | 3.9% |
| Interquartile 75% (IQ3) | 6.5% | 6.8% |
| Interquartile Range (IQR) | 2.5% | 2.9% |
| Standard Deviation (Sample) | 1.8% | 2.4% |
| Standard Deviation (Population) | 1.8% | 2.4% |
Similar Demographics by Single Mother Households
Demographics Similar to Immigrants from Jordan by Single Mother Households
In terms of single mother households, the demographic groups most similar to Immigrants from Jordan are Scotch-Irish (6.0%, a difference of 0.050%), French Canadian (6.0%, a difference of 0.060%), Immigrants from Albania (6.1%, a difference of 0.15%), Zimbabwean (6.1%, a difference of 0.29%), and Immigrants from Southern Europe (6.1%, a difference of 0.34%).
| Demographics | Rating | Rank | Single Mother Households |
| French | 85.7 /100 | #140 | Excellent 6.0% |
| Tsimshian | 85.2 /100 | #141 | Excellent 6.0% |
| Immigrants | Egypt | 85.0 /100 | #142 | Excellent 6.0% |
| Immigrants | Iraq | 84.8 /100 | #143 | Excellent 6.0% |
| Koreans | 84.4 /100 | #144 | Excellent 6.0% |
| Arabs | 84.0 /100 | #145 | Excellent 6.0% |
| French Canadians | 82.6 /100 | #146 | Excellent 6.0% |
| Immigrants | Jordan | 82.3 /100 | #147 | Excellent 6.0% |
| Scotch-Irish | 82.0 /100 | #148 | Excellent 6.0% |
| Immigrants | Albania | 81.5 /100 | #149 | Excellent 6.1% |
| Zimbabweans | 80.7 /100 | #150 | Excellent 6.1% |
| Immigrants | Southern Europe | 80.5 /100 | #151 | Excellent 6.1% |
| Pakistanis | 79.2 /100 | #152 | Good 6.1% |
| Immigrants | Brazil | 78.9 /100 | #153 | Good 6.1% |
| Immigrants | Philippines | 78.5 /100 | #154 | Good 6.1% |
Demographics Similar to Costa Ricans by Single Mother Households
In terms of single mother households, the demographic groups most similar to Costa Ricans are Immigrants from Afghanistan (6.5%, a difference of 0.020%), Ugandan (6.5%, a difference of 0.11%), Ottawa (6.5%, a difference of 0.14%), Ethiopian (6.5%, a difference of 0.17%), and Delaware (6.5%, a difference of 0.21%).
| Demographics | Rating | Rank | Single Mother Households |
| Hmong | 39.8 /100 | #179 | Fair 6.4% |
| Immigrants | Nepal | 36.1 /100 | #180 | Fair 6.4% |
| Spanish | 33.4 /100 | #181 | Fair 6.4% |
| South American Indians | 33.4 /100 | #182 | Fair 6.4% |
| Spaniards | 27.8 /100 | #183 | Fair 6.5% |
| Ethiopians | 26.0 /100 | #184 | Fair 6.5% |
| Ugandans | 25.6 /100 | #185 | Fair 6.5% |
| Costa Ricans | 24.8 /100 | #186 | Fair 6.5% |
| Immigrants | Afghanistan | 24.7 /100 | #187 | Fair 6.5% |
| Ottawa | 23.8 /100 | #188 | Fair 6.5% |
| Delaware | 23.3 /100 | #189 | Fair 6.5% |
| Peruvians | 21.6 /100 | #190 | Fair 6.5% |
| Samoans | 21.2 /100 | #191 | Fair 6.5% |
| Americans | 19.0 /100 | #192 | Poor 6.6% |
| Colombians | 18.3 /100 | #193 | Poor 6.6% |