Immigrants from Israel vs Basque 3 or more Vehicles in Household
COMPARE
Immigrants from Israel
Basque
3 or more Vehicles in Household
3 or more Vehicles in Household Comparison
Immigrants from Israel
Basques
15.6%
3 OR MORE VEHICLES IN HOUSEHOLD
0.0/ 100
METRIC RATING
313th/ 347
METRIC RANK
24.3%
3 OR MORE VEHICLES IN HOUSEHOLD
100.0/ 100
METRIC RATING
16th/ 347
METRIC RANK
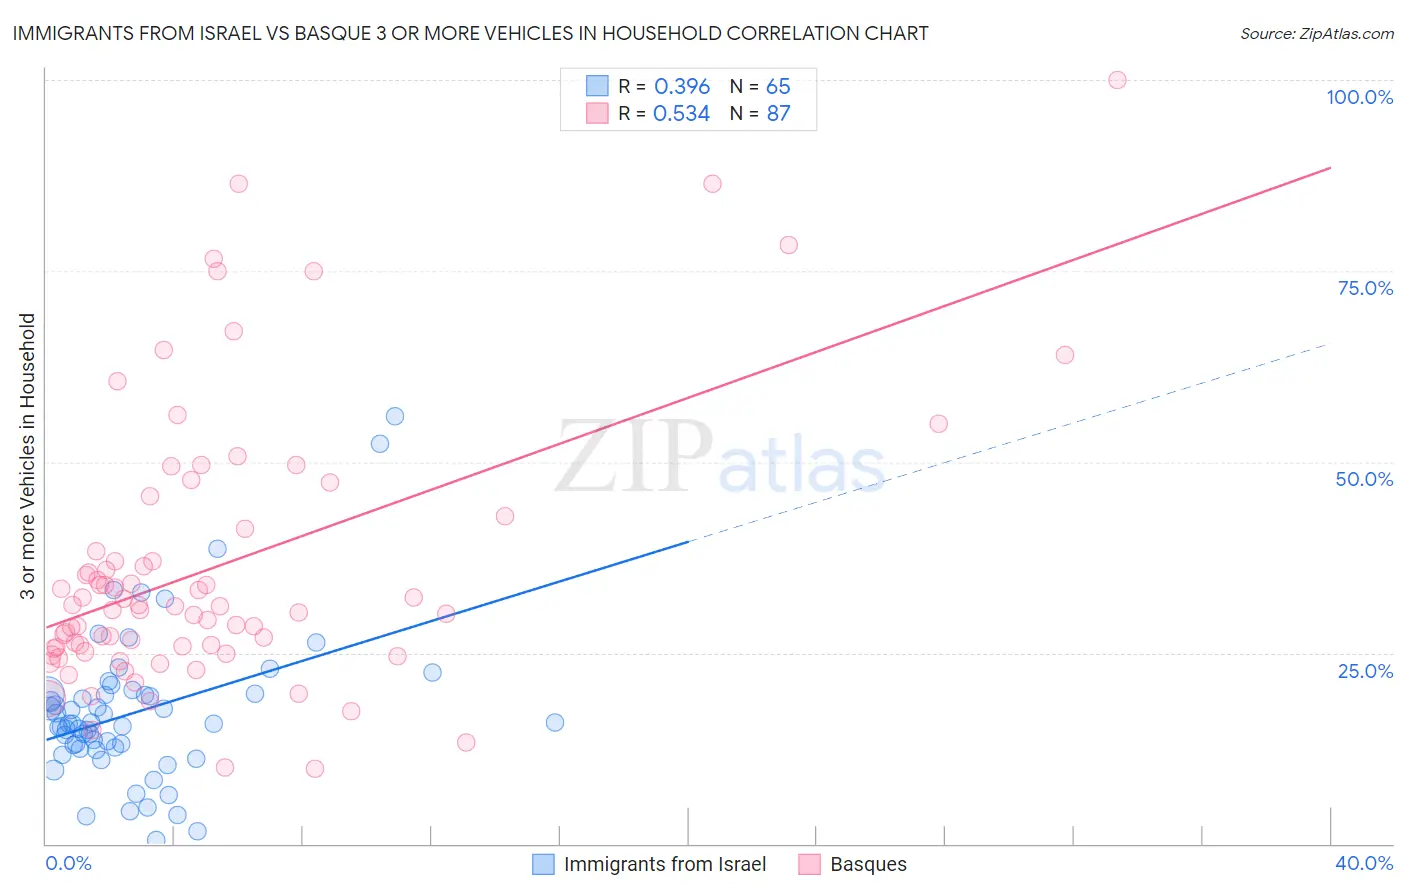
Immigrants from Israel vs Basque 3 or more Vehicles in Household Correlation Chart
The statistical analysis conducted on geographies consisting of 209,931,156 people shows a mild positive correlation between the proportion of Immigrants from Israel and percentage of households with 3 or more vehicles available in the United States with a correlation coefficient (R) of 0.396 and weighted average of 15.6%. Similarly, the statistical analysis conducted on geographies consisting of 165,726,625 people shows a substantial positive correlation between the proportion of Basques and percentage of households with 3 or more vehicles available in the United States with a correlation coefficient (R) of 0.534 and weighted average of 24.3%, a difference of 55.3%.
3 or more Vehicles in Household Correlation Summary
| Measurement | Immigrants from Israel | Basque |
| Minimum | 0.45% | 9.9% |
| Maximum | 55.9% | 100.0% |
| Range | 55.5% | 90.1% |
| Mean | 17.3% | 36.3% |
| Median | 15.7% | 31.1% |
| Interquartile 25% (IQ1) | 12.5% | 25.6% |
| Interquartile 75% (IQ3) | 19.6% | 41.2% |
| Interquartile Range (IQR) | 7.1% | 15.6% |
| Standard Deviation (Sample) | 9.9% | 18.1% |
| Standard Deviation (Population) | 9.9% | 18.0% |
Similar Demographics by 3 or more Vehicles in Household
Demographics Similar to Immigrants from Israel by 3 or more Vehicles in Household
In terms of 3 or more vehicles in household, the demographic groups most similar to Immigrants from Israel are Puerto Rican (15.6%, a difference of 0.020%), Immigrants from Belarus (15.5%, a difference of 0.64%), Haitian (15.5%, a difference of 0.96%), Albanian (15.8%, a difference of 1.2%), and U.S. Virgin Islander (15.4%, a difference of 1.5%).
| Demographics | Rating | Rank | 3 or more Vehicles in Household |
| Somalis | 0.0 /100 | #306 | Tragic 16.2% |
| Immigrants | Ghana | 0.0 /100 | #307 | Tragic 16.2% |
| Houma | 0.0 /100 | #308 | Tragic 16.1% |
| Immigrants | Somalia | 0.0 /100 | #309 | Tragic 15.9% |
| Moroccans | 0.0 /100 | #310 | Tragic 15.9% |
| Albanians | 0.0 /100 | #311 | Tragic 15.8% |
| Puerto Ricans | 0.0 /100 | #312 | Tragic 15.6% |
| Immigrants | Israel | 0.0 /100 | #313 | Tragic 15.6% |
| Immigrants | Belarus | 0.0 /100 | #314 | Tragic 15.5% |
| Haitians | 0.0 /100 | #315 | Tragic 15.5% |
| U.S. Virgin Islanders | 0.0 /100 | #316 | Tragic 15.4% |
| Jamaicans | 0.0 /100 | #317 | Tragic 15.2% |
| Immigrants | Haiti | 0.0 /100 | #318 | Tragic 15.2% |
| Cape Verdeans | 0.0 /100 | #319 | Tragic 15.0% |
| Yup'ik | 0.0 /100 | #320 | Tragic 14.8% |
Demographics Similar to Basques by 3 or more Vehicles in Household
In terms of 3 or more vehicles in household, the demographic groups most similar to Basques are Hawaiian (24.3%, a difference of 0.030%), Korean (24.1%, a difference of 0.80%), Immigrants from Mexico (24.6%, a difference of 1.4%), Norwegian (23.9%, a difference of 1.6%), and Chinese (23.9%, a difference of 1.6%).
| Demographics | Rating | Rank | 3 or more Vehicles in Household |
| Native Hawaiians | 100.0 /100 | #9 | Exceptional 24.9% |
| Nepalese | 100.0 /100 | #10 | Exceptional 24.9% |
| Shoshone | 100.0 /100 | #11 | Exceptional 24.9% |
| Danes | 100.0 /100 | #12 | Exceptional 24.7% |
| Mexicans | 100.0 /100 | #13 | Exceptional 24.7% |
| Immigrants | Mexico | 100.0 /100 | #14 | Exceptional 24.6% |
| Hawaiians | 100.0 /100 | #15 | Exceptional 24.3% |
| Basques | 100.0 /100 | #16 | Exceptional 24.3% |
| Koreans | 100.0 /100 | #17 | Exceptional 24.1% |
| Norwegians | 100.0 /100 | #18 | Exceptional 23.9% |
| Chinese | 100.0 /100 | #19 | Exceptional 23.9% |
| Paiute | 100.0 /100 | #20 | Exceptional 23.8% |
| Immigrants | Vietnam | 100.0 /100 | #21 | Exceptional 23.8% |
| Immigrants | Philippines | 100.0 /100 | #22 | Exceptional 23.8% |
| Scandinavians | 100.0 /100 | #23 | Exceptional 23.6% |