Immigrants from Iraq vs Mexican American Indian 2 or more Vehicles in Household
COMPARE
Immigrants from Iraq
Mexican American Indian
2 or more Vehicles in Household
2 or more Vehicles in Household Comparison
Immigrants from Iraq
Mexican American Indians
58.1%
2 OR MORE VEHICLES IN HOUSEHOLD
99.3/ 100
METRIC RATING
81st/ 347
METRIC RANK
58.7%
2 OR MORE VEHICLES IN HOUSEHOLD
99.8/ 100
METRIC RATING
63rd/ 347
METRIC RANK
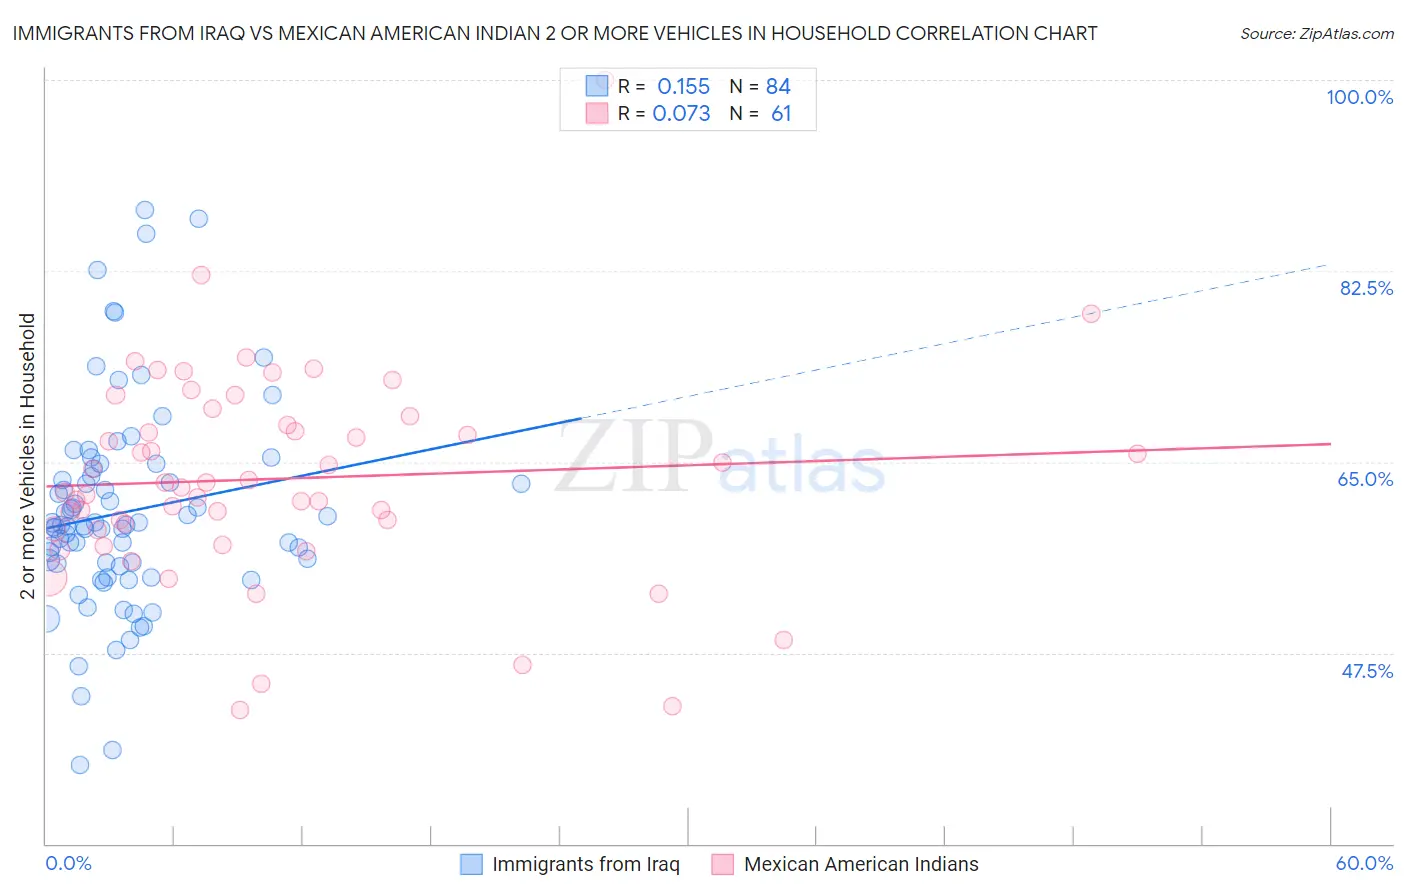
Immigrants from Iraq vs Mexican American Indian 2 or more Vehicles in Household Correlation Chart
The statistical analysis conducted on geographies consisting of 194,767,944 people shows a poor positive correlation between the proportion of Immigrants from Iraq and percentage of households with 2 or more vehicles available in the United States with a correlation coefficient (R) of 0.155 and weighted average of 58.1%. Similarly, the statistical analysis conducted on geographies consisting of 317,508,638 people shows a slight positive correlation between the proportion of Mexican American Indians and percentage of households with 2 or more vehicles available in the United States with a correlation coefficient (R) of 0.073 and weighted average of 58.7%, a difference of 1.1%.
2 or more Vehicles in Household Correlation Summary
| Measurement | Immigrants from Iraq | Mexican American Indian |
| Minimum | 37.2% | 42.3% |
| Maximum | 88.1% | 100.0% |
| Range | 50.9% | 57.7% |
| Mean | 60.4% | 63.5% |
| Median | 59.2% | 62.7% |
| Interquartile 25% (IQ1) | 55.6% | 58.8% |
| Interquartile 75% (IQ3) | 64.0% | 68.8% |
| Interquartile Range (IQR) | 8.4% | 10.0% |
| Standard Deviation (Sample) | 9.5% | 9.6% |
| Standard Deviation (Population) | 9.4% | 9.5% |
Demographics Similar to Immigrants from Iraq and Mexican American Indians by 2 or more Vehicles in Household
In terms of 2 or more vehicles in household, the demographic groups most similar to Immigrants from Iraq are Immigrants from England (58.1%, a difference of 0.010%), Iranian (58.1%, a difference of 0.080%), Delaware (58.2%, a difference of 0.16%), Lithuanian (58.2%, a difference of 0.23%), and Slovene (58.3%, a difference of 0.29%). Similarly, the demographic groups most similar to Mexican American Indians are Nonimmigrants (58.8%, a difference of 0.070%), Portuguese (58.6%, a difference of 0.16%), Immigrants from Central America (58.6%, a difference of 0.21%), Croatian (58.6%, a difference of 0.21%), and Laotian (58.6%, a difference of 0.23%).
| Demographics | Rating | Rank | 2 or more Vehicles in Household |
| Immigrants | Nonimmigrants | 99.8 /100 | #62 | Exceptional 58.8% |
| Mexican American Indians | 99.8 /100 | #63 | Exceptional 58.7% |
| Portuguese | 99.7 /100 | #64 | Exceptional 58.6% |
| Immigrants | Central America | 99.7 /100 | #65 | Exceptional 58.6% |
| Croatians | 99.7 /100 | #66 | Exceptional 58.6% |
| Laotians | 99.7 /100 | #67 | Exceptional 58.6% |
| Canadians | 99.7 /100 | #68 | Exceptional 58.6% |
| Pennsylvania Germans | 99.7 /100 | #69 | Exceptional 58.5% |
| Italians | 99.6 /100 | #70 | Exceptional 58.4% |
| Bangladeshis | 99.6 /100 | #71 | Exceptional 58.4% |
| Austrians | 99.6 /100 | #72 | Exceptional 58.4% |
| Bolivians | 99.6 /100 | #73 | Exceptional 58.3% |
| Immigrants | Afghanistan | 99.6 /100 | #74 | Exceptional 58.3% |
| Poles | 99.5 /100 | #75 | Exceptional 58.3% |
| Creek | 99.5 /100 | #76 | Exceptional 58.3% |
| Slovenes | 99.5 /100 | #77 | Exceptional 58.3% |
| Lithuanians | 99.5 /100 | #78 | Exceptional 58.2% |
| Delaware | 99.4 /100 | #79 | Exceptional 58.2% |
| Immigrants | England | 99.3 /100 | #80 | Exceptional 58.1% |
| Immigrants | Iraq | 99.3 /100 | #81 | Exceptional 58.1% |
| Iranians | 99.3 /100 | #82 | Exceptional 58.1% |