Scottish vs Black/African American 4 or more Vehicles in Household
COMPARE
Scottish
Black/African American
4 or more Vehicles in Household
4 or more Vehicles in Household Comparison
Scottish
Blacks/African Americans
7.4%
4 OR MORE VEHICLES IN HOUSEHOLD
99.9/ 100
METRIC RATING
70th/ 347
METRIC RANK
5.5%
4 OR MORE VEHICLES IN HOUSEHOLD
0.6/ 100
METRIC RATING
274th/ 347
METRIC RANK
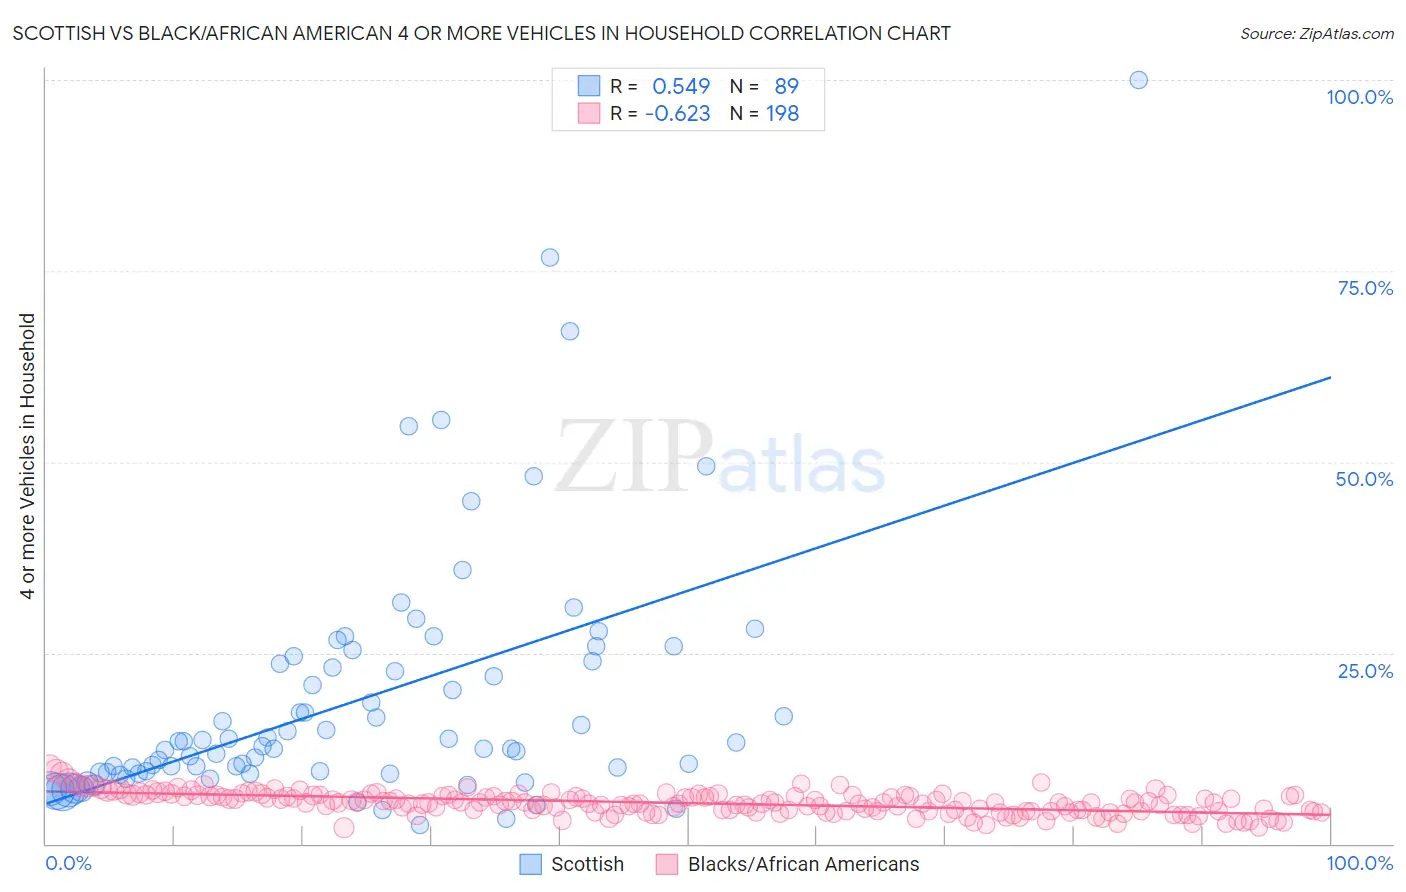
Scottish vs Black/African American 4 or more Vehicles in Household Correlation Chart
The statistical analysis conducted on geographies consisting of 563,736,274 people shows a substantial positive correlation between the proportion of Scottish and percentage of households with 4 or more vehicles available in the United States with a correlation coefficient (R) of 0.549 and weighted average of 7.4%. Similarly, the statistical analysis conducted on geographies consisting of 562,244,951 people shows a significant negative correlation between the proportion of Blacks/African Americans and percentage of households with 4 or more vehicles available in the United States with a correlation coefficient (R) of -0.623 and weighted average of 5.5%, a difference of 35.5%.
4 or more Vehicles in Household Correlation Summary
| Measurement | Scottish | Black/African American |
| Minimum | 2.5% | 2.1% |
| Maximum | 100.0% | 10.1% |
| Range | 97.5% | 8.0% |
| Mean | 18.7% | 5.3% |
| Median | 12.8% | 5.4% |
| Interquartile 25% (IQ1) | 9.3% | 4.3% |
| Interquartile 75% (IQ3) | 23.8% | 6.3% |
| Interquartile Range (IQR) | 14.5% | 2.0% |
| Standard Deviation (Sample) | 16.4% | 1.4% |
| Standard Deviation (Population) | 16.3% | 1.4% |
Similar Demographics by 4 or more Vehicles in Household
Demographics Similar to Scottish by 4 or more Vehicles in Household
In terms of 4 or more vehicles in household, the demographic groups most similar to Scottish are German (7.5%, a difference of 0.070%), Chickasaw (7.4%, a difference of 0.13%), Scotch-Irish (7.4%, a difference of 0.43%), Portuguese (7.4%, a difference of 0.52%), and Welsh (7.5%, a difference of 0.67%).
| Demographics | Rating | Rank | 4 or more Vehicles in Household |
| Immigrants | Micronesia | 100.0 /100 | #63 | Exceptional 7.6% |
| Bangladeshis | 100.0 /100 | #64 | Exceptional 7.6% |
| Immigrants | Azores | 100.0 /100 | #65 | Exceptional 7.5% |
| Immigrants | Taiwan | 99.9 /100 | #66 | Exceptional 7.5% |
| Americans | 99.9 /100 | #67 | Exceptional 7.5% |
| Welsh | 99.9 /100 | #68 | Exceptional 7.5% |
| Germans | 99.9 /100 | #69 | Exceptional 7.5% |
| Scottish | 99.9 /100 | #70 | Exceptional 7.4% |
| Chickasaw | 99.9 /100 | #71 | Exceptional 7.4% |
| Scotch-Irish | 99.9 /100 | #72 | Exceptional 7.4% |
| Portuguese | 99.9 /100 | #73 | Exceptional 7.4% |
| Icelanders | 99.9 /100 | #74 | Exceptional 7.4% |
| Immigrants | Cambodia | 99.9 /100 | #75 | Exceptional 7.4% |
| Laotians | 99.9 /100 | #76 | Exceptional 7.4% |
| Apache | 99.9 /100 | #77 | Exceptional 7.4% |
Demographics Similar to Blacks/African Americans by 4 or more Vehicles in Household
In terms of 4 or more vehicles in household, the demographic groups most similar to Blacks/African Americans are Macedonian (5.5%, a difference of 0.12%), Cambodian (5.5%, a difference of 0.12%), Immigrants from Latvia (5.5%, a difference of 0.13%), Immigrants from Kazakhstan (5.5%, a difference of 0.15%), and Immigrants from Bulgaria (5.5%, a difference of 0.25%).
| Demographics | Rating | Rank | 4 or more Vehicles in Household |
| Immigrants | Ukraine | 0.9 /100 | #267 | Tragic 5.6% |
| Colombians | 0.7 /100 | #268 | Tragic 5.5% |
| Carpatho Rusyns | 0.7 /100 | #269 | Tragic 5.5% |
| Okinawans | 0.6 /100 | #270 | Tragic 5.5% |
| Immigrants | Sudan | 0.6 /100 | #271 | Tragic 5.5% |
| Immigrants | Kazakhstan | 0.6 /100 | #272 | Tragic 5.5% |
| Macedonians | 0.6 /100 | #273 | Tragic 5.5% |
| Blacks/African Americans | 0.6 /100 | #274 | Tragic 5.5% |
| Cambodians | 0.5 /100 | #275 | Tragic 5.5% |
| Immigrants | Latvia | 0.5 /100 | #276 | Tragic 5.5% |
| Immigrants | Bulgaria | 0.5 /100 | #277 | Tragic 5.5% |
| Immigrants | Eastern Europe | 0.4 /100 | #278 | Tragic 5.4% |
| Immigrants | Uruguay | 0.3 /100 | #279 | Tragic 5.4% |
| Alsatians | 0.3 /100 | #280 | Tragic 5.4% |
| Immigrants | Western Africa | 0.3 /100 | #281 | Tragic 5.4% |