Tongan vs Immigrants from Uruguay 3 or more Vehicles in Household
COMPARE
Tongan
Immigrants from Uruguay
3 or more Vehicles in Household
3 or more Vehicles in Household Comparison
Tongans
Immigrants from Uruguay
26.5%
3 OR MORE VEHICLES IN HOUSEHOLD
100.0/ 100
METRIC RATING
3rd/ 347
METRIC RANK
17.1%
3 OR MORE VEHICLES IN HOUSEHOLD
0.2/ 100
METRIC RATING
288th/ 347
METRIC RANK
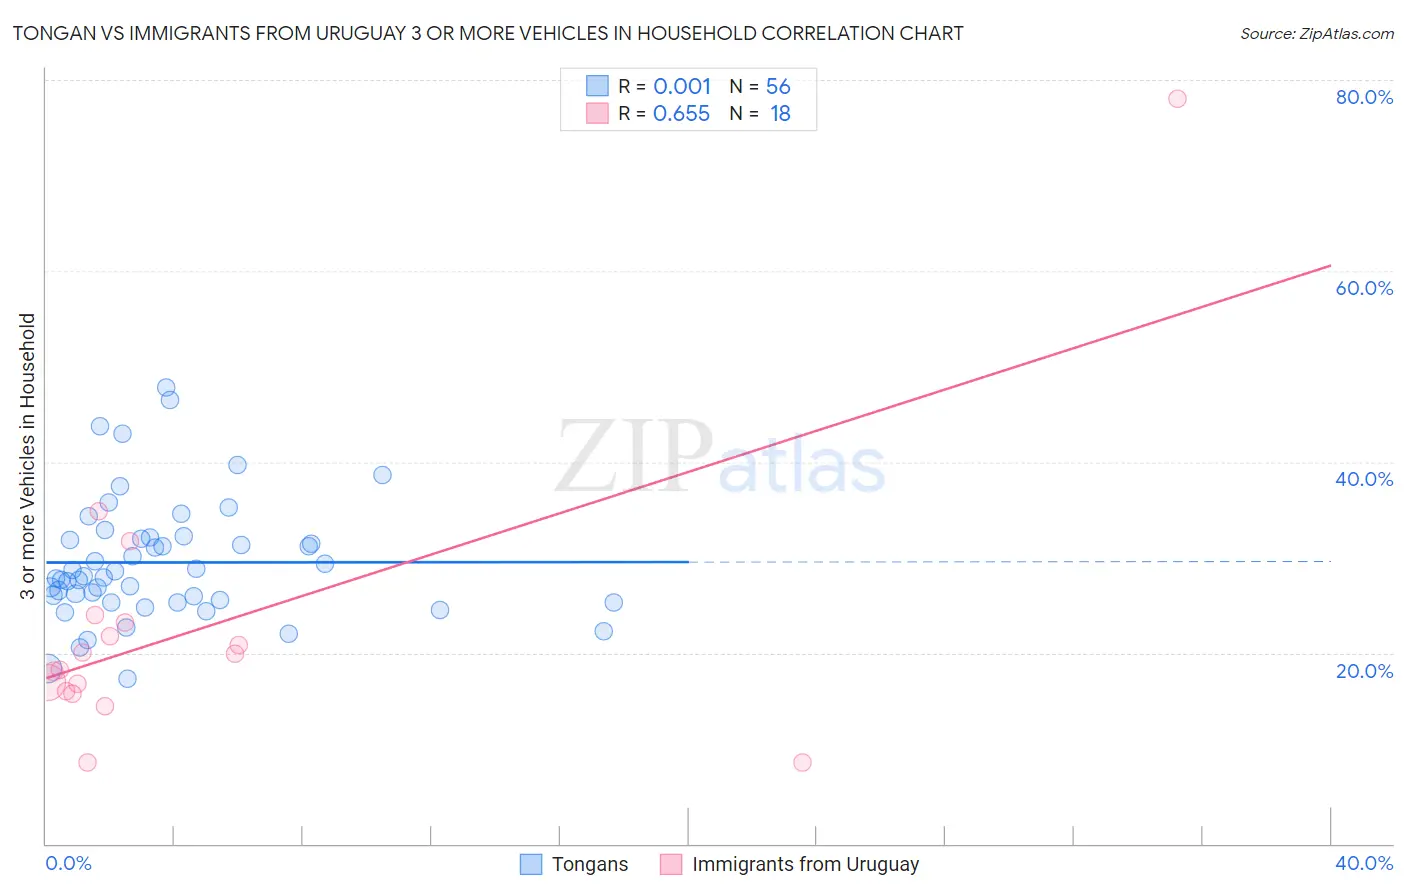
Tongan vs Immigrants from Uruguay 3 or more Vehicles in Household Correlation Chart
The statistical analysis conducted on geographies consisting of 102,870,832 people shows no correlation between the proportion of Tongans and percentage of households with 3 or more vehicles available in the United States with a correlation coefficient (R) of 0.001 and weighted average of 26.5%. Similarly, the statistical analysis conducted on geographies consisting of 133,238,313 people shows a significant positive correlation between the proportion of Immigrants from Uruguay and percentage of households with 3 or more vehicles available in the United States with a correlation coefficient (R) of 0.655 and weighted average of 17.1%, a difference of 55.1%.
3 or more Vehicles in Household Correlation Summary
| Measurement | Tongan | Immigrants from Uruguay |
| Minimum | 17.2% | 8.6% |
| Maximum | 47.8% | 78.0% |
| Range | 30.6% | 69.5% |
| Mean | 29.5% | 22.6% |
| Median | 28.0% | 19.0% |
| Interquartile 25% (IQ1) | 25.4% | 16.0% |
| Interquartile 75% (IQ3) | 32.0% | 23.1% |
| Interquartile Range (IQR) | 6.6% | 7.1% |
| Standard Deviation (Sample) | 6.4% | 15.3% |
| Standard Deviation (Population) | 6.4% | 14.9% |
Similar Demographics by 3 or more Vehicles in Household
Demographics Similar to Tongans by 3 or more Vehicles in Household
In terms of 3 or more vehicles in household, the demographic groups most similar to Tongans are Arapaho (26.4%, a difference of 0.33%), Puget Sound Salish (26.4%, a difference of 0.67%), Spanish American Indian (26.9%, a difference of 1.5%), Immigrants from Fiji (26.1%, a difference of 1.8%), and Colville (25.8%, a difference of 3.0%).
| Demographics | Rating | Rank | 3 or more Vehicles in Household |
| Yakama | 100.0 /100 | #1 | Exceptional 31.0% |
| Spanish American Indians | 100.0 /100 | #2 | Exceptional 26.9% |
| Tongans | 100.0 /100 | #3 | Exceptional 26.5% |
| Arapaho | 100.0 /100 | #4 | Exceptional 26.4% |
| Puget Sound Salish | 100.0 /100 | #5 | Exceptional 26.4% |
| Immigrants | Fiji | 100.0 /100 | #6 | Exceptional 26.1% |
| Colville | 100.0 /100 | #7 | Exceptional 25.8% |
| Samoans | 100.0 /100 | #8 | Exceptional 25.0% |
| Native Hawaiians | 100.0 /100 | #9 | Exceptional 24.9% |
| Nepalese | 100.0 /100 | #10 | Exceptional 24.9% |
| Shoshone | 100.0 /100 | #11 | Exceptional 24.9% |
| Danes | 100.0 /100 | #12 | Exceptional 24.7% |
| Mexicans | 100.0 /100 | #13 | Exceptional 24.7% |
| Immigrants | Mexico | 100.0 /100 | #14 | Exceptional 24.6% |
| Hawaiians | 100.0 /100 | #15 | Exceptional 24.3% |
Demographics Similar to Immigrants from Uruguay by 3 or more Vehicles in Household
In terms of 3 or more vehicles in household, the demographic groups most similar to Immigrants from Uruguay are Immigrants from Liberia (17.1%, a difference of 0.070%), Immigrants from Brazil (17.1%, a difference of 0.090%), Menominee (17.2%, a difference of 0.39%), Immigrants from Croatia (17.2%, a difference of 0.45%), and Liberian (17.0%, a difference of 0.64%).
| Demographics | Rating | Rank | 3 or more Vehicles in Household |
| Immigrants | Latvia | 0.3 /100 | #281 | Tragic 17.4% |
| Immigrants | Ireland | 0.3 /100 | #282 | Tragic 17.3% |
| Blacks/African Americans | 0.3 /100 | #283 | Tragic 17.3% |
| Immigrants | Colombia | 0.3 /100 | #284 | Tragic 17.3% |
| Immigrants | Croatia | 0.2 /100 | #285 | Tragic 17.2% |
| Menominee | 0.2 /100 | #286 | Tragic 17.2% |
| Immigrants | Brazil | 0.2 /100 | #287 | Tragic 17.1% |
| Immigrants | Uruguay | 0.2 /100 | #288 | Tragic 17.1% |
| Immigrants | Liberia | 0.1 /100 | #289 | Tragic 17.1% |
| Liberians | 0.1 /100 | #290 | Tragic 17.0% |
| Immigrants | Congo | 0.1 /100 | #291 | Tragic 17.0% |
| Immigrants | Spain | 0.1 /100 | #292 | Tragic 17.0% |
| Bahamians | 0.1 /100 | #293 | Tragic 16.9% |
| Immigrants | Western Africa | 0.1 /100 | #294 | Tragic 16.9% |
| Immigrants | Russia | 0.1 /100 | #295 | Tragic 16.9% |