Immigrants from Honduras vs Immigrants from Senegal 2 or more Vehicles in Household
COMPARE
Immigrants from Honduras
Immigrants from Senegal
2 or more Vehicles in Household
2 or more Vehicles in Household Comparison
Immigrants from Honduras
Immigrants from Senegal
51.8%
2 OR MORE VEHICLES IN HOUSEHOLD
0.2/ 100
METRIC RATING
275th/ 347
METRIC RANK
43.0%
2 OR MORE VEHICLES IN HOUSEHOLD
0.0/ 100
METRIC RATING
326th/ 347
METRIC RANK
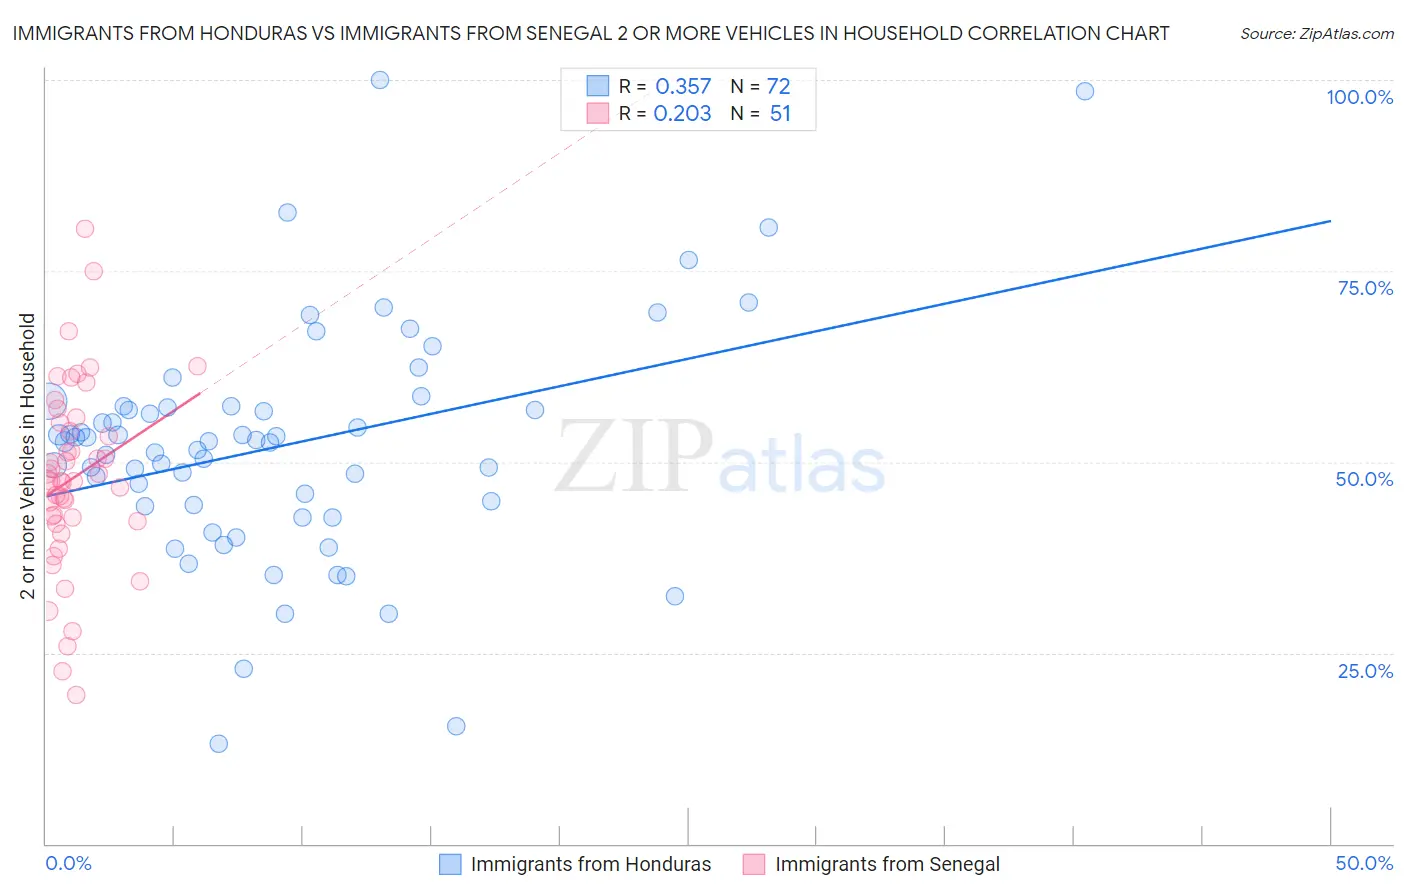
Immigrants from Honduras vs Immigrants from Senegal 2 or more Vehicles in Household Correlation Chart
The statistical analysis conducted on geographies consisting of 322,483,271 people shows a mild positive correlation between the proportion of Immigrants from Honduras and percentage of households with 2 or more vehicles available in the United States with a correlation coefficient (R) of 0.357 and weighted average of 51.8%. Similarly, the statistical analysis conducted on geographies consisting of 90,124,695 people shows a weak positive correlation between the proportion of Immigrants from Senegal and percentage of households with 2 or more vehicles available in the United States with a correlation coefficient (R) of 0.203 and weighted average of 43.0%, a difference of 20.4%.
2 or more Vehicles in Household Correlation Summary
| Measurement | Immigrants from Honduras | Immigrants from Senegal |
| Minimum | 13.2% | 19.5% |
| Maximum | 100.0% | 80.4% |
| Range | 86.8% | 61.0% |
| Mean | 52.1% | 47.9% |
| Median | 52.7% | 47.5% |
| Interquartile 25% (IQ1) | 44.2% | 42.3% |
| Interquartile 75% (IQ3) | 57.2% | 55.2% |
| Interquartile Range (IQR) | 12.9% | 12.9% |
| Standard Deviation (Sample) | 15.3% | 12.1% |
| Standard Deviation (Population) | 15.2% | 12.0% |
Similar Demographics by 2 or more Vehicles in Household
Demographics Similar to Immigrants from Honduras by 2 or more Vehicles in Household
In terms of 2 or more vehicles in household, the demographic groups most similar to Immigrants from Honduras are African (51.8%, a difference of 0.020%), Immigrants from Croatia (51.8%, a difference of 0.030%), Israeli (51.9%, a difference of 0.060%), Immigrants from Africa (51.8%, a difference of 0.080%), and Yuman (51.7%, a difference of 0.14%).
| Demographics | Rating | Rank | 2 or more Vehicles in Household |
| Pima | 0.2 /100 | #268 | Tragic 52.0% |
| Hondurans | 0.2 /100 | #269 | Tragic 52.0% |
| Immigrants | Ireland | 0.2 /100 | #270 | Tragic 52.0% |
| South Americans | 0.2 /100 | #271 | Tragic 51.9% |
| Sub-Saharan Africans | 0.2 /100 | #272 | Tragic 51.9% |
| Israelis | 0.2 /100 | #273 | Tragic 51.9% |
| Africans | 0.2 /100 | #274 | Tragic 51.8% |
| Immigrants | Honduras | 0.2 /100 | #275 | Tragic 51.8% |
| Immigrants | Croatia | 0.2 /100 | #276 | Tragic 51.8% |
| Immigrants | Africa | 0.2 /100 | #277 | Tragic 51.8% |
| Yuman | 0.1 /100 | #278 | Tragic 51.7% |
| Liberians | 0.1 /100 | #279 | Tragic 51.7% |
| Immigrants | Eastern Europe | 0.1 /100 | #280 | Tragic 51.7% |
| Immigrants | Kazakhstan | 0.1 /100 | #281 | Tragic 51.6% |
| Bahamians | 0.1 /100 | #282 | Tragic 51.5% |
Demographics Similar to Immigrants from Senegal by 2 or more Vehicles in Household
In terms of 2 or more vehicles in household, the demographic groups most similar to Immigrants from Senegal are Immigrants from West Indies (43.1%, a difference of 0.15%), Immigrants from Yemen (42.8%, a difference of 0.41%), Immigrants from Cabo Verde (43.3%, a difference of 0.72%), Inupiat (42.6%, a difference of 0.91%), and Ecuadorian (42.0%, a difference of 2.5%).
| Demographics | Rating | Rank | 2 or more Vehicles in Household |
| Jamaicans | 0.0 /100 | #319 | Tragic 45.8% |
| Soviet Union | 0.0 /100 | #320 | Tragic 45.7% |
| Immigrants | Jamaica | 0.0 /100 | #321 | Tragic 44.5% |
| Senegalese | 0.0 /100 | #322 | Tragic 44.2% |
| Immigrants | Caribbean | 0.0 /100 | #323 | Tragic 44.2% |
| Immigrants | Cabo Verde | 0.0 /100 | #324 | Tragic 43.3% |
| Immigrants | West Indies | 0.0 /100 | #325 | Tragic 43.1% |
| Immigrants | Senegal | 0.0 /100 | #326 | Tragic 43.0% |
| Immigrants | Yemen | 0.0 /100 | #327 | Tragic 42.8% |
| Inupiat | 0.0 /100 | #328 | Tragic 42.6% |
| Ecuadorians | 0.0 /100 | #329 | Tragic 42.0% |
| Immigrants | Dominica | 0.0 /100 | #330 | Tragic 41.6% |
| West Indians | 0.0 /100 | #331 | Tragic 41.3% |
| Trinidadians and Tobagonians | 0.0 /100 | #332 | Tragic 40.9% |
| Immigrants | Ecuador | 0.0 /100 | #333 | Tragic 40.5% |