Immigrants from Honduras vs Immigrants from Senegal In Labor Force | Age 30-34
COMPARE
Immigrants from Honduras
Immigrants from Senegal
In Labor Force | Age 30-34
In Labor Force | Age 30-34 Comparison
Immigrants from Honduras
Immigrants from Senegal
83.7%
IN LABOR FORCE | AGE 30-34
0.1/ 100
METRIC RATING
265th/ 347
METRIC RANK
84.8%
IN LABOR FORCE | AGE 30-34
74.0/ 100
METRIC RATING
151st/ 347
METRIC RANK
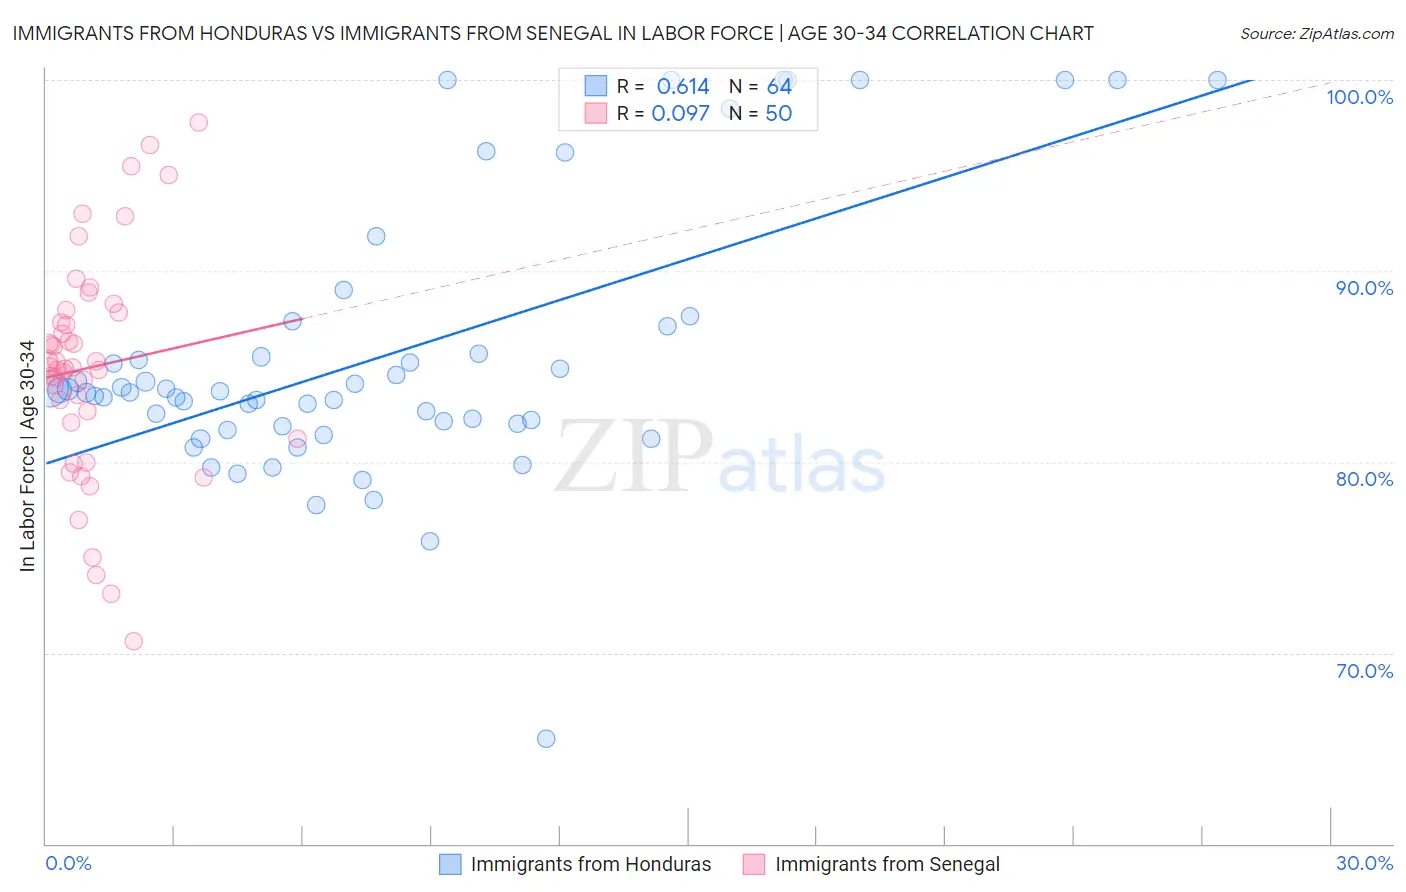
Immigrants from Honduras vs Immigrants from Senegal In Labor Force | Age 30-34 Correlation Chart
The statistical analysis conducted on geographies consisting of 322,455,880 people shows a significant positive correlation between the proportion of Immigrants from Honduras and labor force participation rate among population between the ages 30 and 34 in the United States with a correlation coefficient (R) of 0.614 and weighted average of 83.7%. Similarly, the statistical analysis conducted on geographies consisting of 90,111,000 people shows a slight positive correlation between the proportion of Immigrants from Senegal and labor force participation rate among population between the ages 30 and 34 in the United States with a correlation coefficient (R) of 0.097 and weighted average of 84.8%, a difference of 1.3%.
In Labor Force | Age 30-34 Correlation Summary
| Measurement | Immigrants from Honduras | Immigrants from Senegal |
| Minimum | 65.5% | 70.6% |
| Maximum | 100.0% | 97.8% |
| Range | 34.5% | 27.2% |
| Mean | 85.6% | 84.9% |
| Median | 83.7% | 84.9% |
| Interquartile 25% (IQ1) | 81.9% | 82.1% |
| Interquartile 75% (IQ3) | 86.4% | 87.8% |
| Interquartile Range (IQR) | 4.5% | 5.7% |
| Standard Deviation (Sample) | 7.1% | 5.8% |
| Standard Deviation (Population) | 7.1% | 5.7% |
Similar Demographics by In Labor Force | Age 30-34
Demographics Similar to Immigrants from Honduras by In Labor Force | Age 30-34
In terms of in labor force | age 30-34, the demographic groups most similar to Immigrants from Honduras are Immigrants from Guatemala (83.7%, a difference of 0.020%), Guatemalan (83.7%, a difference of 0.030%), Dominican (83.8%, a difference of 0.080%), Immigrants from Guyana (83.8%, a difference of 0.080%), and Guyanese (83.8%, a difference of 0.10%).
| Demographics | Rating | Rank | In Labor Force | Age 30-34 |
| Hondurans | 0.3 /100 | #258 | Tragic 83.8% |
| Scotch-Irish | 0.3 /100 | #259 | Tragic 83.8% |
| Immigrants | Dominican Republic | 0.3 /100 | #260 | Tragic 83.8% |
| Guyanese | 0.3 /100 | #261 | Tragic 83.8% |
| Dominicans | 0.2 /100 | #262 | Tragic 83.8% |
| Immigrants | Guyana | 0.2 /100 | #263 | Tragic 83.8% |
| Guatemalans | 0.2 /100 | #264 | Tragic 83.7% |
| Immigrants | Honduras | 0.1 /100 | #265 | Tragic 83.7% |
| Immigrants | Guatemala | 0.1 /100 | #266 | Tragic 83.7% |
| Spaniards | 0.1 /100 | #267 | Tragic 83.6% |
| Immigrants | Bangladesh | 0.1 /100 | #268 | Tragic 83.6% |
| Vietnamese | 0.1 /100 | #269 | Tragic 83.6% |
| Spanish Americans | 0.0 /100 | #270 | Tragic 83.5% |
| Spanish | 0.0 /100 | #271 | Tragic 83.5% |
| Immigrants | Nonimmigrants | 0.0 /100 | #272 | Tragic 83.5% |
Demographics Similar to Immigrants from Senegal by In Labor Force | Age 30-34
In terms of in labor force | age 30-34, the demographic groups most similar to Immigrants from Senegal are Romanian (84.8%, a difference of 0.0%), Immigrants from Ukraine (84.8%, a difference of 0.010%), German (84.8%, a difference of 0.010%), Immigrants from Saudi Arabia (84.9%, a difference of 0.020%), and Immigrants from Colombia (84.9%, a difference of 0.020%).
| Demographics | Rating | Rank | In Labor Force | Age 30-34 |
| Uruguayans | 78.5 /100 | #144 | Good 84.9% |
| Palestinians | 77.7 /100 | #145 | Good 84.9% |
| Immigrants | Saudi Arabia | 76.6 /100 | #146 | Good 84.9% |
| Immigrants | Colombia | 76.3 /100 | #147 | Good 84.9% |
| Immigrants | Pakistan | 76.2 /100 | #148 | Good 84.9% |
| Immigrants | Ukraine | 75.1 /100 | #149 | Good 84.8% |
| Germans | 75.1 /100 | #150 | Good 84.8% |
| Immigrants | Senegal | 74.0 /100 | #151 | Good 84.8% |
| Romanians | 73.5 /100 | #152 | Good 84.8% |
| Syrians | 70.1 /100 | #153 | Good 84.8% |
| Northern Europeans | 70.0 /100 | #154 | Good 84.8% |
| Immigrants | Sudan | 69.5 /100 | #155 | Good 84.8% |
| French Canadians | 67.3 /100 | #156 | Good 84.8% |
| Peruvians | 65.9 /100 | #157 | Good 84.8% |
| Immigrants | Armenia | 64.7 /100 | #158 | Good 84.8% |