Immigrants from Haiti vs Arab 2 or more Vehicles in Household
COMPARE
Immigrants from Haiti
Arab
2 or more Vehicles in Household
2 or more Vehicles in Household Comparison
Immigrants from Haiti
Arabs
46.5%
2 OR MORE VEHICLES IN HOUSEHOLD
0.0/ 100
METRIC RATING
317th/ 347
METRIC RANK
55.0%
2 OR MORE VEHICLES IN HOUSEHOLD
35.9/ 100
METRIC RATING
185th/ 347
METRIC RANK
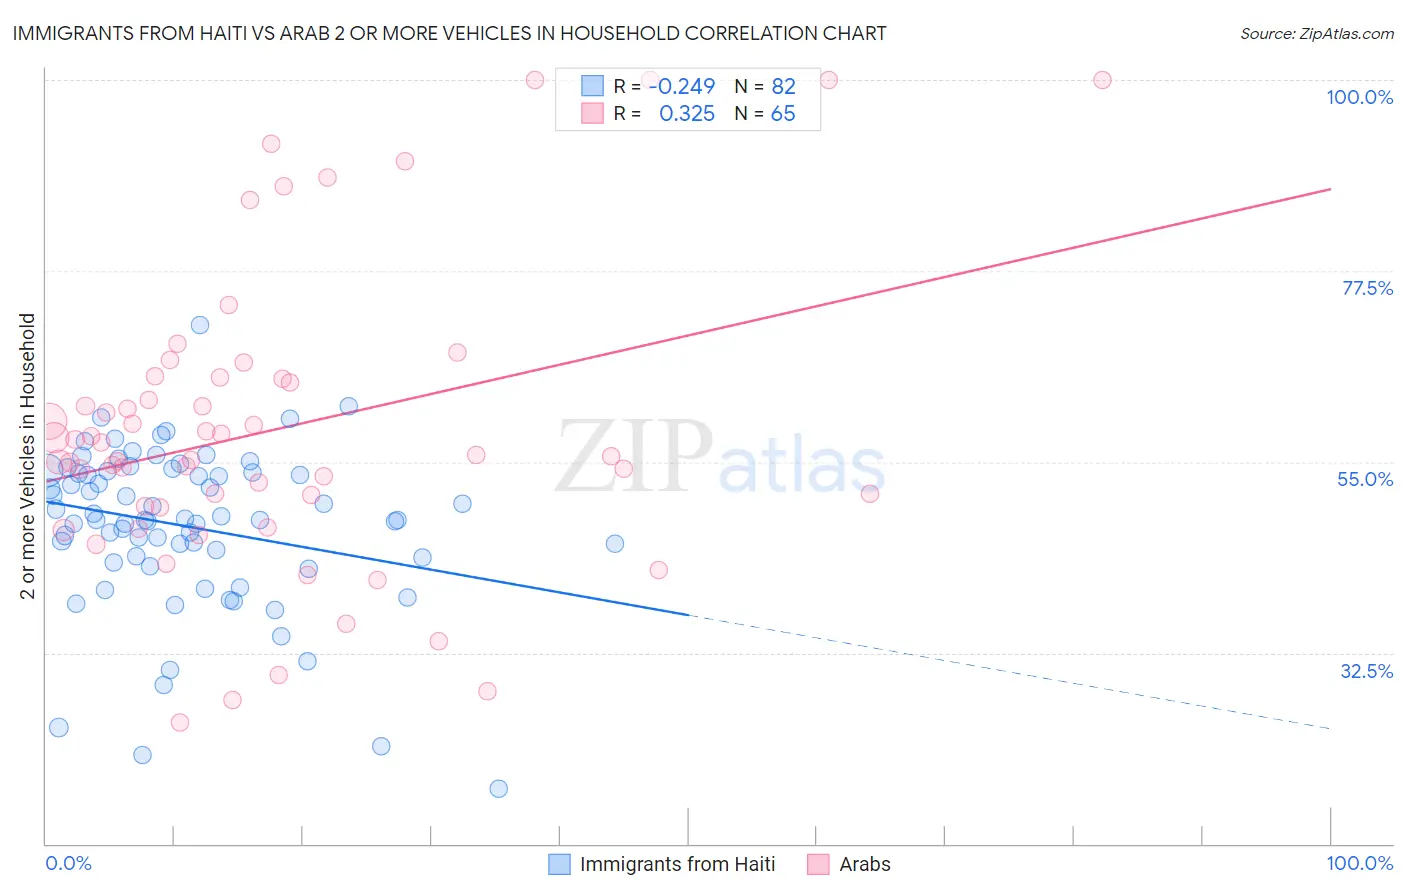
Immigrants from Haiti vs Arab 2 or more Vehicles in Household Correlation Chart
The statistical analysis conducted on geographies consisting of 225,179,274 people shows a weak negative correlation between the proportion of Immigrants from Haiti and percentage of households with 2 or more vehicles available in the United States with a correlation coefficient (R) of -0.249 and weighted average of 46.5%. Similarly, the statistical analysis conducted on geographies consisting of 486,450,180 people shows a mild positive correlation between the proportion of Arabs and percentage of households with 2 or more vehicles available in the United States with a correlation coefficient (R) of 0.325 and weighted average of 55.0%, a difference of 18.3%.
2 or more Vehicles in Household Correlation Summary
| Measurement | Immigrants from Haiti | Arab |
| Minimum | 16.5% | 24.3% |
| Maximum | 71.1% | 100.0% |
| Range | 54.6% | 75.7% |
| Mean | 47.4% | 58.8% |
| Median | 48.2% | 55.8% |
| Interquartile 25% (IQ1) | 43.7% | 49.7% |
| Interquartile 75% (IQ3) | 53.7% | 64.9% |
| Interquartile Range (IQR) | 9.9% | 15.2% |
| Standard Deviation (Sample) | 9.5% | 17.5% |
| Standard Deviation (Population) | 9.5% | 17.4% |
Similar Demographics by 2 or more Vehicles in Household
Demographics Similar to Immigrants from Haiti by 2 or more Vehicles in Household
In terms of 2 or more vehicles in household, the demographic groups most similar to Immigrants from Haiti are Cape Verdean (46.8%, a difference of 0.53%), Immigrants from Albania (46.0%, a difference of 1.1%), Puerto Rican (47.1%, a difference of 1.2%), Jamaican (45.8%, a difference of 1.7%), and Soviet Union (45.7%, a difference of 1.7%).
| Demographics | Rating | Rank | 2 or more Vehicles in Household |
| Ghanaians | 0.0 /100 | #310 | Tragic 48.0% |
| Immigrants | Belarus | 0.0 /100 | #311 | Tragic 47.9% |
| Haitians | 0.0 /100 | #312 | Tragic 47.6% |
| U.S. Virgin Islanders | 0.0 /100 | #313 | Tragic 47.5% |
| Immigrants | Ghana | 0.0 /100 | #314 | Tragic 47.4% |
| Puerto Ricans | 0.0 /100 | #315 | Tragic 47.1% |
| Cape Verdeans | 0.0 /100 | #316 | Tragic 46.8% |
| Immigrants | Haiti | 0.0 /100 | #317 | Tragic 46.5% |
| Immigrants | Albania | 0.0 /100 | #318 | Tragic 46.0% |
| Jamaicans | 0.0 /100 | #319 | Tragic 45.8% |
| Soviet Union | 0.0 /100 | #320 | Tragic 45.7% |
| Immigrants | Jamaica | 0.0 /100 | #321 | Tragic 44.5% |
| Senegalese | 0.0 /100 | #322 | Tragic 44.2% |
| Immigrants | Caribbean | 0.0 /100 | #323 | Tragic 44.2% |
| Immigrants | Cabo Verde | 0.0 /100 | #324 | Tragic 43.3% |
Demographics Similar to Arabs by 2 or more Vehicles in Household
In terms of 2 or more vehicles in household, the demographic groups most similar to Arabs are Apache (55.1%, a difference of 0.030%), Immigrants from Cameroon (55.1%, a difference of 0.060%), Immigrants from Micronesia (55.1%, a difference of 0.10%), Cree (55.1%, a difference of 0.10%), and Peruvian (55.0%, a difference of 0.10%).
| Demographics | Rating | Rank | 2 or more Vehicles in Household |
| Immigrants | Sweden | 45.3 /100 | #178 | Average 55.2% |
| Alaskan Athabascans | 42.9 /100 | #179 | Average 55.2% |
| Immigrants | Kenya | 40.4 /100 | #180 | Average 55.1% |
| Immigrants | Micronesia | 38.2 /100 | #181 | Fair 55.1% |
| Cree | 38.2 /100 | #182 | Fair 55.1% |
| Immigrants | Cameroon | 37.3 /100 | #183 | Fair 55.1% |
| Apache | 36.7 /100 | #184 | Fair 55.1% |
| Arabs | 35.9 /100 | #185 | Fair 55.0% |
| Peruvians | 33.7 /100 | #186 | Fair 55.0% |
| Immigrants | Uganda | 33.4 /100 | #187 | Fair 55.0% |
| Marshallese | 30.5 /100 | #188 | Fair 54.9% |
| Eastern Europeans | 27.5 /100 | #189 | Fair 54.8% |
| Russians | 26.3 /100 | #190 | Fair 54.8% |
| Immigrants | Immigrants | 25.0 /100 | #191 | Fair 54.7% |
| Immigrants | Romania | 23.8 /100 | #192 | Fair 54.7% |