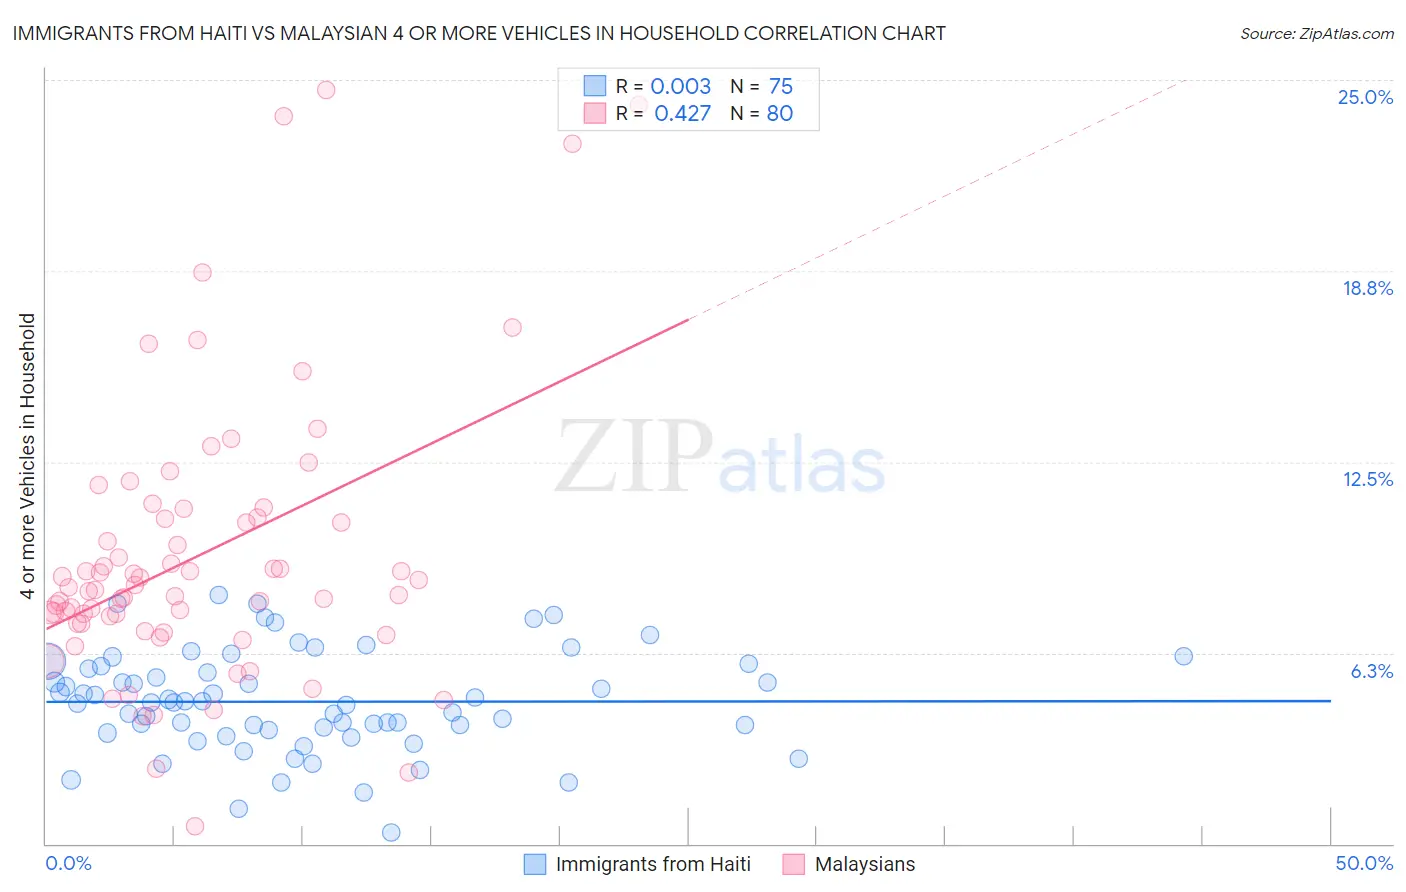
Immigrants from Haiti vs Malaysian 4 or more Vehicles in Household
COMPARE
Immigrants from Haiti
Malaysian
4 or more Vehicles in Household
4 or more Vehicles in Household Comparison
Immigrants from Haiti
Malaysians
4.5%
4 OR MORE VEHICLES IN HOUSEHOLD
0.0/ 100
METRIC RATING
320th/ 347
METRIC RANK
7.7%
4 OR MORE VEHICLES IN HOUSEHOLD
100.0/ 100
METRIC RATING
53rd/ 347
METRIC RANK
Immigrants from Haiti vs Malaysian 4 or more Vehicles in Household Correlation Chart
The statistical analysis conducted on geographies consisting of 223,924,769 people shows no correlation between the proportion of Immigrants from Haiti and percentage of households with 4 or more vehicles available in the United States with a correlation coefficient (R) of 0.003 and weighted average of 4.5%. Similarly, the statistical analysis conducted on geographies consisting of 225,515,285 people shows a moderate positive correlation between the proportion of Malaysians and percentage of households with 4 or more vehicles available in the United States with a correlation coefficient (R) of 0.427 and weighted average of 7.7%, a difference of 70.4%.
4 or more Vehicles in Household Correlation Summary
| Measurement | Immigrants from Haiti | Malaysian |
| Minimum | 0.37% | 0.58% |
| Maximum | 8.2% | 24.7% |
| Range | 7.8% | 24.1% |
| Mean | 4.7% | 9.4% |
| Median | 4.6% | 8.3% |
| Interquartile 25% (IQ1) | 3.7% | 7.2% |
| Interquartile 75% (IQ3) | 5.8% | 10.6% |
| Interquartile Range (IQR) | 2.1% | 3.4% |
| Standard Deviation (Sample) | 1.6% | 4.6% |
| Standard Deviation (Population) | 1.6% | 4.6% |
Similar Demographics by 4 or more Vehicles in Household
Demographics Similar to Immigrants from Haiti by 4 or more Vehicles in Household
In terms of 4 or more vehicles in household, the demographic groups most similar to Immigrants from Haiti are Ecuadorian (4.5%, a difference of 0.75%), Immigrants from Yemen (4.5%, a difference of 0.93%), Immigrants from Caribbean (4.4%, a difference of 1.3%), Soviet Union (4.4%, a difference of 1.6%), and Immigrants from Jamaica (4.4%, a difference of 1.9%).
| Demographics | Rating | Rank | 4 or more Vehicles in Household |
| Immigrants | Israel | 0.0 /100 | #313 | Tragic 4.8% |
| Immigrants | West Indies | 0.0 /100 | #314 | Tragic 4.7% |
| Immigrants | Belarus | 0.0 /100 | #315 | Tragic 4.7% |
| Puerto Ricans | 0.0 /100 | #316 | Tragic 4.7% |
| U.S. Virgin Islanders | 0.0 /100 | #317 | Tragic 4.6% |
| Jamaicans | 0.0 /100 | #318 | Tragic 4.6% |
| Haitians | 0.0 /100 | #319 | Tragic 4.6% |
| Immigrants | Haiti | 0.0 /100 | #320 | Tragic 4.5% |
| Ecuadorians | 0.0 /100 | #321 | Tragic 4.5% |
| Immigrants | Yemen | 0.0 /100 | #322 | Tragic 4.5% |
| Immigrants | Caribbean | 0.0 /100 | #323 | Tragic 4.4% |
| Soviet Union | 0.0 /100 | #324 | Tragic 4.4% |
| Immigrants | Jamaica | 0.0 /100 | #325 | Tragic 4.4% |
| Cape Verdeans | 0.0 /100 | #326 | Tragic 4.4% |
| Senegalese | 0.0 /100 | #327 | Tragic 4.3% |
Demographics Similar to Malaysians by 4 or more Vehicles in Household
In terms of 4 or more vehicles in household, the demographic groups most similar to Malaysians are Dutch (7.7%, a difference of 0.070%), Japanese (7.7%, a difference of 0.38%), Immigrants from Oceania (7.6%, a difference of 0.47%), English (7.6%, a difference of 0.48%), and Immigrants from Laos (7.7%, a difference of 0.50%).
| Demographics | Rating | Rank | 4 or more Vehicles in Household |
| Crow | 100.0 /100 | #46 | Exceptional 7.8% |
| Osage | 100.0 /100 | #47 | Exceptional 7.8% |
| Swiss | 100.0 /100 | #48 | Exceptional 7.8% |
| Cherokee | 100.0 /100 | #49 | Exceptional 7.7% |
| Immigrants | El Salvador | 100.0 /100 | #50 | Exceptional 7.7% |
| Immigrants | Laos | 100.0 /100 | #51 | Exceptional 7.7% |
| Japanese | 100.0 /100 | #52 | Exceptional 7.7% |
| Malaysians | 100.0 /100 | #53 | Exceptional 7.7% |
| Dutch | 100.0 /100 | #54 | Exceptional 7.7% |
| Immigrants | Oceania | 100.0 /100 | #55 | Exceptional 7.6% |
| English | 100.0 /100 | #56 | Exceptional 7.6% |
| Pennsylvania Germans | 100.0 /100 | #57 | Exceptional 7.6% |
| Swedes | 100.0 /100 | #58 | Exceptional 7.6% |
| Hispanics or Latinos | 100.0 /100 | #59 | Exceptional 7.6% |
| Spaniards | 100.0 /100 | #60 | Exceptional 7.6% |