Immigrants from Haiti vs Immigrants from Greece 4 or more Vehicles in Household
COMPARE
Immigrants from Haiti
Immigrants from Greece
4 or more Vehicles in Household
4 or more Vehicles in Household Comparison
Immigrants from Haiti
Immigrants from Greece
4.5%
4 OR MORE VEHICLES IN HOUSEHOLD
0.0/ 100
METRIC RATING
320th/ 347
METRIC RANK
5.1%
4 OR MORE VEHICLES IN HOUSEHOLD
0.0/ 100
METRIC RATING
303rd/ 347
METRIC RANK
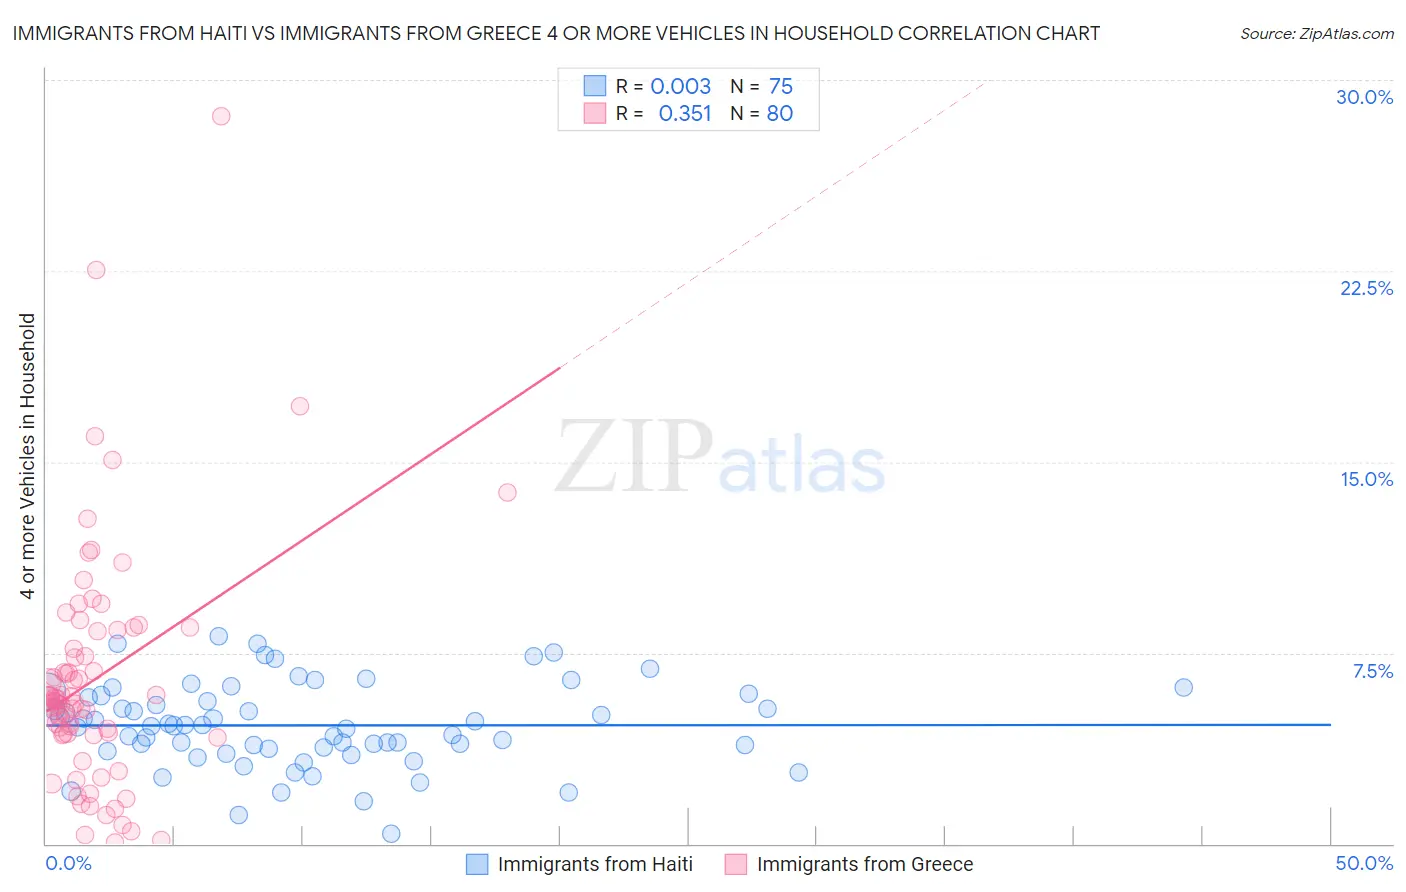
Immigrants from Haiti vs Immigrants from Greece 4 or more Vehicles in Household Correlation Chart
The statistical analysis conducted on geographies consisting of 223,924,769 people shows no correlation between the proportion of Immigrants from Haiti and percentage of households with 4 or more vehicles available in the United States with a correlation coefficient (R) of 0.003 and weighted average of 4.5%. Similarly, the statistical analysis conducted on geographies consisting of 215,892,328 people shows a mild positive correlation between the proportion of Immigrants from Greece and percentage of households with 4 or more vehicles available in the United States with a correlation coefficient (R) of 0.351 and weighted average of 5.1%, a difference of 12.3%.
4 or more Vehicles in Household Correlation Summary
| Measurement | Immigrants from Haiti | Immigrants from Greece |
| Minimum | 0.37% | 0.039% |
| Maximum | 8.2% | 28.6% |
| Range | 7.8% | 28.5% |
| Mean | 4.7% | 6.5% |
| Median | 4.6% | 5.6% |
| Interquartile 25% (IQ1) | 3.7% | 4.3% |
| Interquartile 75% (IQ3) | 5.8% | 8.4% |
| Interquartile Range (IQR) | 2.1% | 4.1% |
| Standard Deviation (Sample) | 1.6% | 4.7% |
| Standard Deviation (Population) | 1.6% | 4.7% |
Demographics Similar to Immigrants from Haiti and Immigrants from Greece by 4 or more Vehicles in Household
In terms of 4 or more vehicles in household, the demographic groups most similar to Immigrants from Haiti are Ecuadorian (4.5%, a difference of 0.75%), Haitian (4.6%, a difference of 2.3%), Jamaican (4.6%, a difference of 3.0%), U.S. Virgin Islander (4.6%, a difference of 3.2%), and Puerto Rican (4.7%, a difference of 5.0%). Similarly, the demographic groups most similar to Immigrants from Greece are Bahamian (5.1%, a difference of 0.47%), Cypriot (5.0%, a difference of 0.55%), Somali (5.0%, a difference of 0.56%), Immigrants from Serbia (5.0%, a difference of 0.64%), and Immigrants from Zaire (5.1%, a difference of 0.77%).
| Demographics | Rating | Rank | 4 or more Vehicles in Household |
| Immigrants | Zaire | 0.0 /100 | #301 | Tragic 5.1% |
| Bahamians | 0.0 /100 | #302 | Tragic 5.1% |
| Immigrants | Greece | 0.0 /100 | #303 | Tragic 5.1% |
| Cypriots | 0.0 /100 | #304 | Tragic 5.0% |
| Somalis | 0.0 /100 | #305 | Tragic 5.0% |
| Immigrants | Serbia | 0.0 /100 | #306 | Tragic 5.0% |
| Menominee | 0.0 /100 | #307 | Tragic 5.0% |
| Paraguayans | 0.0 /100 | #308 | Tragic 4.9% |
| Immigrants | Somalia | 0.0 /100 | #309 | Tragic 4.9% |
| Moroccans | 0.0 /100 | #310 | Tragic 4.9% |
| Houma | 0.0 /100 | #311 | Tragic 4.9% |
| Albanians | 0.0 /100 | #312 | Tragic 4.8% |
| Immigrants | Israel | 0.0 /100 | #313 | Tragic 4.8% |
| Immigrants | West Indies | 0.0 /100 | #314 | Tragic 4.7% |
| Immigrants | Belarus | 0.0 /100 | #315 | Tragic 4.7% |
| Puerto Ricans | 0.0 /100 | #316 | Tragic 4.7% |
| U.S. Virgin Islanders | 0.0 /100 | #317 | Tragic 4.6% |
| Jamaicans | 0.0 /100 | #318 | Tragic 4.6% |
| Haitians | 0.0 /100 | #319 | Tragic 4.6% |
| Immigrants | Haiti | 0.0 /100 | #320 | Tragic 4.5% |
| Ecuadorians | 0.0 /100 | #321 | Tragic 4.5% |