Immigrants from Haiti vs Arab Disability Age Over 75
COMPARE
Immigrants from Haiti
Arab
Disability Age Over 75
Disability Age Over 75 Comparison
Immigrants from Haiti
Arabs
47.3%
DISABILITY AGE OVER 75
49.7/ 100
METRIC RATING
175th/ 347
METRIC RANK
47.1%
DISABILITY AGE OVER 75
73.3/ 100
METRIC RATING
156th/ 347
METRIC RANK
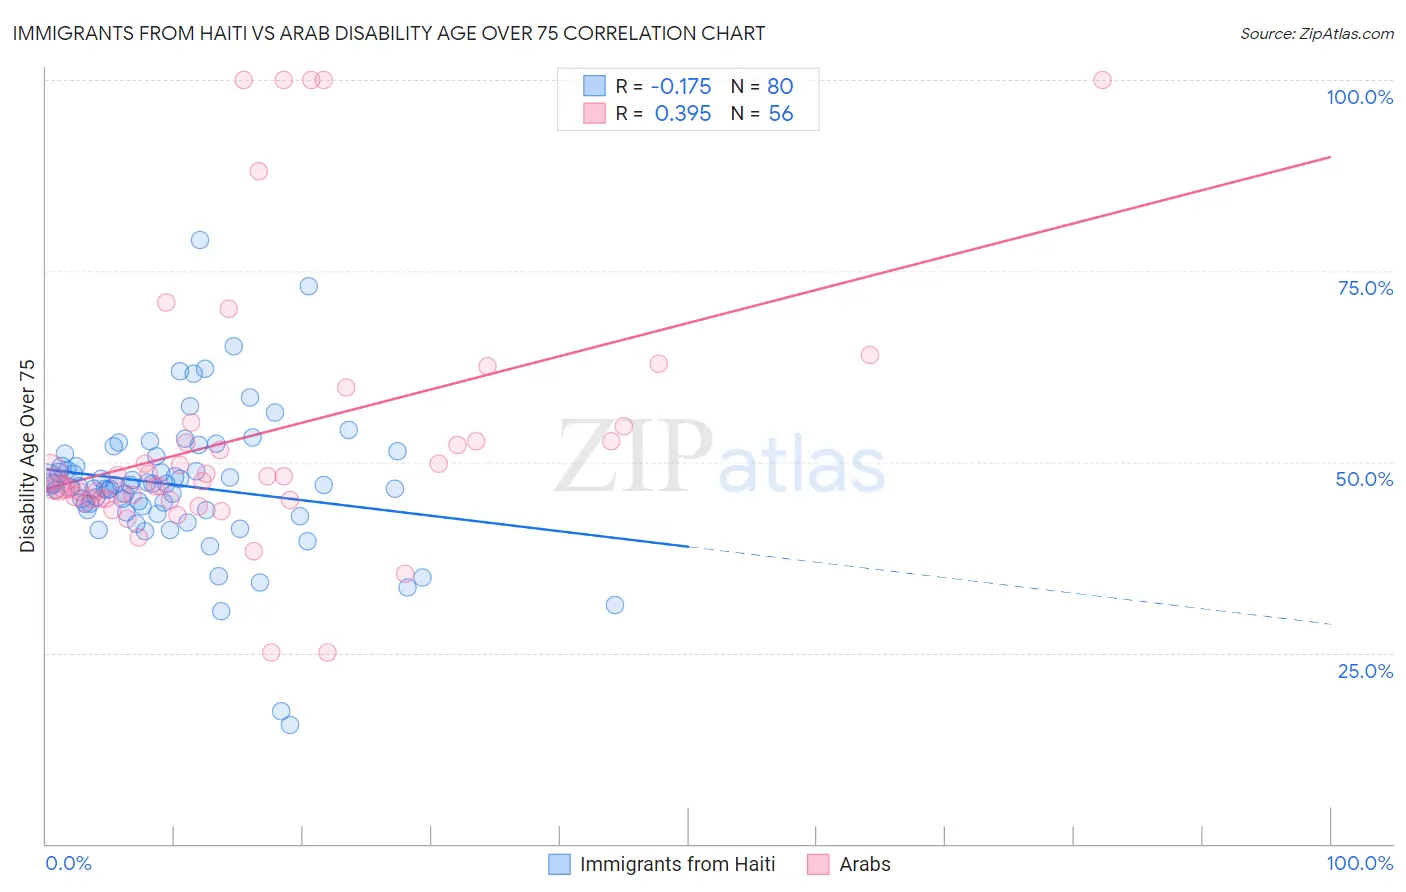
Immigrants from Haiti vs Arab Disability Age Over 75 Correlation Chart
The statistical analysis conducted on geographies consisting of 224,903,072 people shows a poor negative correlation between the proportion of Immigrants from Haiti and percentage of population with a disability over the age of 75 in the United States with a correlation coefficient (R) of -0.175 and weighted average of 47.3%. Similarly, the statistical analysis conducted on geographies consisting of 485,582,526 people shows a mild positive correlation between the proportion of Arabs and percentage of population with a disability over the age of 75 in the United States with a correlation coefficient (R) of 0.395 and weighted average of 47.1%, a difference of 0.58%.
Disability Age Over 75 Correlation Summary
| Measurement | Immigrants from Haiti | Arab |
| Minimum | 15.6% | 25.0% |
| Maximum | 79.0% | 100.0% |
| Range | 63.5% | 75.0% |
| Mean | 46.9% | 53.5% |
| Median | 46.9% | 47.8% |
| Interquartile 25% (IQ1) | 43.7% | 45.2% |
| Interquartile 75% (IQ3) | 50.1% | 53.7% |
| Interquartile Range (IQR) | 6.4% | 8.5% |
| Standard Deviation (Sample) | 9.3% | 17.6% |
| Standard Deviation (Population) | 9.2% | 17.4% |
Demographics Similar to Immigrants from Haiti and Arabs by Disability Age Over 75
In terms of disability age over 75, the demographic groups most similar to Immigrants from Haiti are White/Caucasian (47.3%, a difference of 0.010%), Alsatian (47.3%, a difference of 0.050%), Scotch-Irish (47.3%, a difference of 0.060%), Immigrants from Africa (47.3%, a difference of 0.090%), and German Russian (47.3%, a difference of 0.15%). Similarly, the demographic groups most similar to Arabs are Bhutanese (47.1%, a difference of 0.020%), Immigrants from Iran (47.1%, a difference of 0.040%), Immigrants from Guyana (47.1%, a difference of 0.040%), Immigrants from Morocco (47.1%, a difference of 0.050%), and Immigrants from Middle Africa (47.1%, a difference of 0.14%).
| Demographics | Rating | Rank | Disability Age Over 75 |
| Immigrants | Iran | 74.7 /100 | #155 | Good 47.1% |
| Arabs | 73.3 /100 | #156 | Good 47.1% |
| Bhutanese | 72.6 /100 | #157 | Good 47.1% |
| Immigrants | Guyana | 71.9 /100 | #158 | Good 47.1% |
| Immigrants | Morocco | 71.4 /100 | #159 | Good 47.1% |
| Immigrants | Middle Africa | 68.3 /100 | #160 | Good 47.1% |
| South American Indians | 68.1 /100 | #161 | Good 47.1% |
| Pennsylvania Germans | 66.0 /100 | #162 | Good 47.2% |
| Immigrants | Eastern Africa | 65.5 /100 | #163 | Good 47.2% |
| French | 64.6 /100 | #164 | Good 47.2% |
| Immigrants | Zimbabwe | 64.4 /100 | #165 | Good 47.2% |
| Immigrants | Sierra Leone | 64.4 /100 | #166 | Good 47.2% |
| Moroccans | 62.9 /100 | #167 | Good 47.2% |
| Kenyans | 58.8 /100 | #168 | Average 47.2% |
| Celtics | 58.7 /100 | #169 | Average 47.2% |
| German Russians | 56.2 /100 | #170 | Average 47.3% |
| Immigrants | Africa | 53.6 /100 | #171 | Average 47.3% |
| Scotch-Irish | 52.5 /100 | #172 | Average 47.3% |
| Alsatians | 51.9 /100 | #173 | Average 47.3% |
| Whites/Caucasians | 50.0 /100 | #174 | Average 47.3% |
| Immigrants | Haiti | 49.7 /100 | #175 | Average 47.3% |