Immigrants from Sudan vs Immigrants from Haiti 4 or more Vehicles in Household
COMPARE
Immigrants from Sudan
Immigrants from Haiti
4 or more Vehicles in Household
4 or more Vehicles in Household Comparison
Immigrants from Sudan
Immigrants from Haiti
5.5%
4 OR MORE VEHICLES IN HOUSEHOLD
0.6/ 100
METRIC RATING
271st/ 347
METRIC RANK
4.5%
4 OR MORE VEHICLES IN HOUSEHOLD
0.0/ 100
METRIC RATING
320th/ 347
METRIC RANK
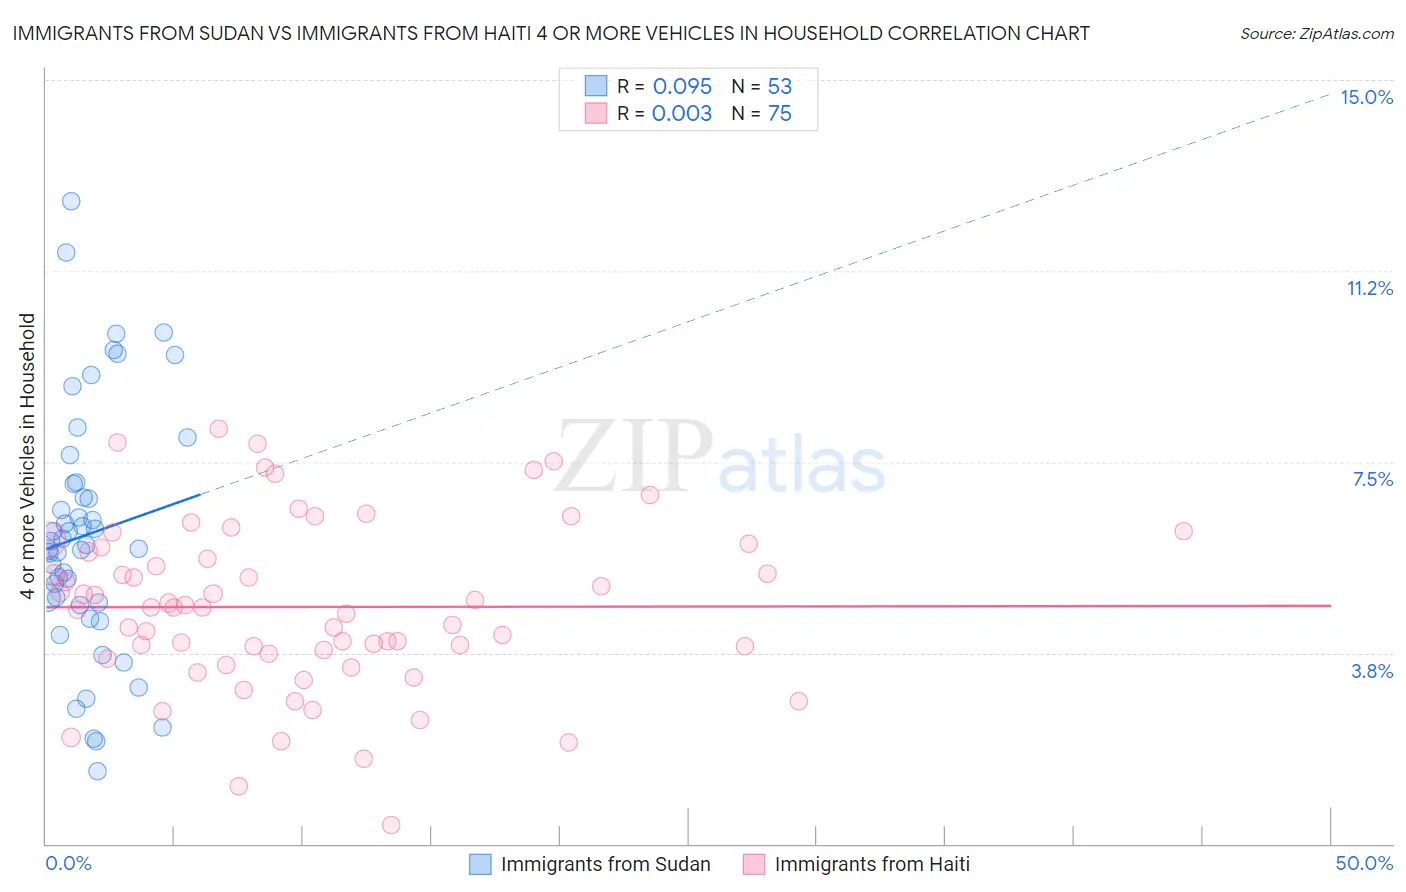
Immigrants from Sudan vs Immigrants from Haiti 4 or more Vehicles in Household Correlation Chart
The statistical analysis conducted on geographies consisting of 118,789,653 people shows a slight positive correlation between the proportion of Immigrants from Sudan and percentage of households with 4 or more vehicles available in the United States with a correlation coefficient (R) of 0.095 and weighted average of 5.5%. Similarly, the statistical analysis conducted on geographies consisting of 223,924,769 people shows no correlation between the proportion of Immigrants from Haiti and percentage of households with 4 or more vehicles available in the United States with a correlation coefficient (R) of 0.003 and weighted average of 4.5%, a difference of 22.6%.
4 or more Vehicles in Household Correlation Summary
| Measurement | Immigrants from Sudan | Immigrants from Haiti |
| Minimum | 1.4% | 0.37% |
| Maximum | 12.6% | 8.2% |
| Range | 11.2% | 7.8% |
| Mean | 6.1% | 4.7% |
| Median | 5.9% | 4.6% |
| Interquartile 25% (IQ1) | 4.7% | 3.7% |
| Interquartile 75% (IQ3) | 7.1% | 5.8% |
| Interquartile Range (IQR) | 2.4% | 2.1% |
| Standard Deviation (Sample) | 2.4% | 1.6% |
| Standard Deviation (Population) | 2.4% | 1.6% |
Similar Demographics by 4 or more Vehicles in Household
Demographics Similar to Immigrants from Sudan by 4 or more Vehicles in Household
In terms of 4 or more vehicles in household, the demographic groups most similar to Immigrants from Sudan are Okinawan (5.5%, a difference of 0.10%), Immigrants from Kazakhstan (5.5%, a difference of 0.19%), Macedonian (5.5%, a difference of 0.23%), Carpatho Rusyn (5.5%, a difference of 0.30%), and Black/African American (5.5%, a difference of 0.35%).
| Demographics | Rating | Rank | 4 or more Vehicles in Household |
| Immigrants | Africa | 1.0 /100 | #264 | Tragic 5.6% |
| South Americans | 0.9 /100 | #265 | Tragic 5.6% |
| Immigrants | Nepal | 0.9 /100 | #266 | Tragic 5.6% |
| Immigrants | Ukraine | 0.9 /100 | #267 | Tragic 5.6% |
| Colombians | 0.7 /100 | #268 | Tragic 5.5% |
| Carpatho Rusyns | 0.7 /100 | #269 | Tragic 5.5% |
| Okinawans | 0.6 /100 | #270 | Tragic 5.5% |
| Immigrants | Sudan | 0.6 /100 | #271 | Tragic 5.5% |
| Immigrants | Kazakhstan | 0.6 /100 | #272 | Tragic 5.5% |
| Macedonians | 0.6 /100 | #273 | Tragic 5.5% |
| Blacks/African Americans | 0.6 /100 | #274 | Tragic 5.5% |
| Cambodians | 0.5 /100 | #275 | Tragic 5.5% |
| Immigrants | Latvia | 0.5 /100 | #276 | Tragic 5.5% |
| Immigrants | Bulgaria | 0.5 /100 | #277 | Tragic 5.5% |
| Immigrants | Eastern Europe | 0.4 /100 | #278 | Tragic 5.4% |
Demographics Similar to Immigrants from Haiti by 4 or more Vehicles in Household
In terms of 4 or more vehicles in household, the demographic groups most similar to Immigrants from Haiti are Ecuadorian (4.5%, a difference of 0.75%), Immigrants from Yemen (4.5%, a difference of 0.93%), Immigrants from Caribbean (4.4%, a difference of 1.3%), Soviet Union (4.4%, a difference of 1.6%), and Immigrants from Jamaica (4.4%, a difference of 1.9%).
| Demographics | Rating | Rank | 4 or more Vehicles in Household |
| Immigrants | Israel | 0.0 /100 | #313 | Tragic 4.8% |
| Immigrants | West Indies | 0.0 /100 | #314 | Tragic 4.7% |
| Immigrants | Belarus | 0.0 /100 | #315 | Tragic 4.7% |
| Puerto Ricans | 0.0 /100 | #316 | Tragic 4.7% |
| U.S. Virgin Islanders | 0.0 /100 | #317 | Tragic 4.6% |
| Jamaicans | 0.0 /100 | #318 | Tragic 4.6% |
| Haitians | 0.0 /100 | #319 | Tragic 4.6% |
| Immigrants | Haiti | 0.0 /100 | #320 | Tragic 4.5% |
| Ecuadorians | 0.0 /100 | #321 | Tragic 4.5% |
| Immigrants | Yemen | 0.0 /100 | #322 | Tragic 4.5% |
| Immigrants | Caribbean | 0.0 /100 | #323 | Tragic 4.4% |
| Soviet Union | 0.0 /100 | #324 | Tragic 4.4% |
| Immigrants | Jamaica | 0.0 /100 | #325 | Tragic 4.4% |
| Cape Verdeans | 0.0 /100 | #326 | Tragic 4.4% |
| Senegalese | 0.0 /100 | #327 | Tragic 4.3% |