Immigrants from Germany vs Croatian Divorced or Separated
COMPARE
Immigrants from Germany
Croatian
Divorced or Separated
Divorced or Separated Comparison
Immigrants from Germany
Croatians
12.4%
DIVORCED OR SEPARATED
4.0/ 100
METRIC RATING
239th/ 347
METRIC RANK
11.9%
DIVORCED OR SEPARATED
80.6/ 100
METRIC RATING
145th/ 347
METRIC RANK
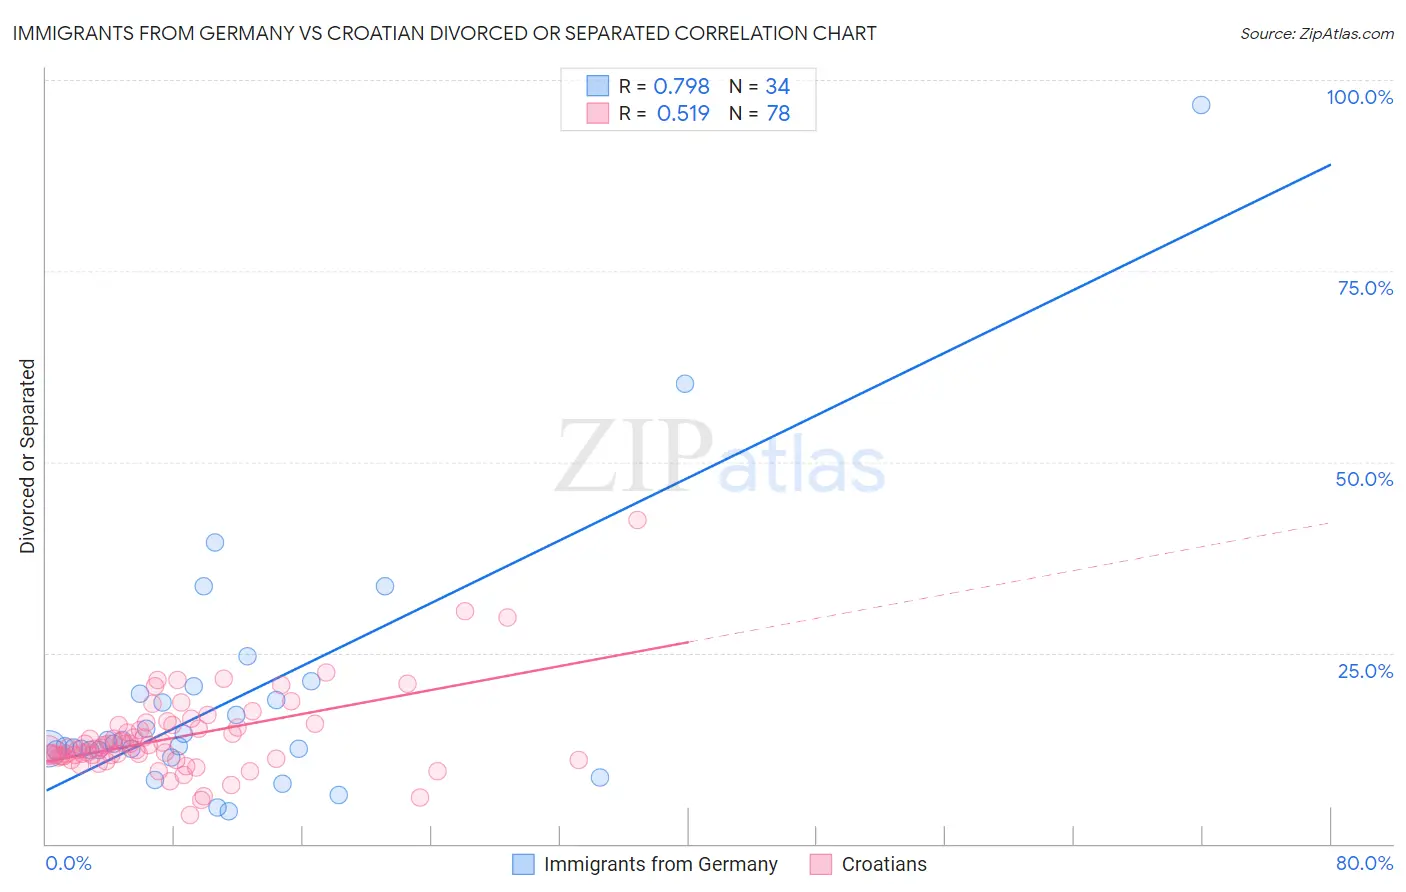
Immigrants from Germany vs Croatian Divorced or Separated Correlation Chart
The statistical analysis conducted on geographies consisting of 463,791,501 people shows a strong positive correlation between the proportion of Immigrants from Germany and percentage of population currently divorced or separated in the United States with a correlation coefficient (R) of 0.798 and weighted average of 12.4%. Similarly, the statistical analysis conducted on geographies consisting of 375,586,631 people shows a substantial positive correlation between the proportion of Croatians and percentage of population currently divorced or separated in the United States with a correlation coefficient (R) of 0.519 and weighted average of 11.9%, a difference of 4.0%.
Divorced or Separated Correlation Summary
| Measurement | Immigrants from Germany | Croatian |
| Minimum | 4.2% | 3.7% |
| Maximum | 96.8% | 42.4% |
| Range | 92.6% | 38.7% |
| Mean | 19.1% | 14.0% |
| Median | 13.0% | 12.6% |
| Interquartile 25% (IQ1) | 12.3% | 11.4% |
| Interquartile 75% (IQ3) | 19.6% | 15.6% |
| Interquartile Range (IQR) | 7.3% | 4.2% |
| Standard Deviation (Sample) | 17.6% | 5.7% |
| Standard Deviation (Population) | 17.3% | 5.6% |
Similar Demographics by Divorced or Separated
Demographics Similar to Immigrants from Germany by Divorced or Separated
In terms of divorced or separated, the demographic groups most similar to Immigrants from Germany are Sudanese (12.4%, a difference of 0.010%), Colombian (12.4%, a difference of 0.040%), Immigrants from Laos (12.4%, a difference of 0.040%), British West Indian (12.4%, a difference of 0.050%), and Immigrants from Bosnia and Herzegovina (12.4%, a difference of 0.070%).
| Demographics | Rating | Rank | Divorced or Separated |
| Canadians | 5.3 /100 | #232 | Tragic 12.4% |
| Malaysians | 4.8 /100 | #233 | Tragic 12.4% |
| West Indians | 4.4 /100 | #234 | Tragic 12.4% |
| Immigrants | Bosnia and Herzegovina | 4.3 /100 | #235 | Tragic 12.4% |
| Colombians | 4.2 /100 | #236 | Tragic 12.4% |
| Immigrants | Laos | 4.2 /100 | #237 | Tragic 12.4% |
| Sudanese | 4.0 /100 | #238 | Tragic 12.4% |
| Immigrants | Germany | 4.0 /100 | #239 | Tragic 12.4% |
| British West Indians | 3.7 /100 | #240 | Tragic 12.4% |
| Uruguayans | 3.4 /100 | #241 | Tragic 12.4% |
| Dutch | 3.1 /100 | #242 | Tragic 12.4% |
| Immigrants | Latin America | 2.8 /100 | #243 | Tragic 12.4% |
| Alaska Natives | 2.5 /100 | #244 | Tragic 12.4% |
| Hispanics or Latinos | 2.0 /100 | #245 | Tragic 12.5% |
| Immigrants | West Indies | 1.9 /100 | #246 | Tragic 12.5% |
Demographics Similar to Croatians by Divorced or Separated
In terms of divorced or separated, the demographic groups most similar to Croatians are Peruvian (11.9%, a difference of 0.020%), Immigrants from Zimbabwe (11.9%, a difference of 0.050%), Pakistani (11.9%, a difference of 0.050%), Immigrants from Grenada (11.9%, a difference of 0.080%), and Polish (11.9%, a difference of 0.11%).
| Demographics | Rating | Rank | Divorced or Separated |
| Immigrants | Netherlands | 83.9 /100 | #138 | Excellent 11.9% |
| Australians | 83.6 /100 | #139 | Excellent 11.9% |
| Lebanese | 83.4 /100 | #140 | Excellent 11.9% |
| Immigrants | Morocco | 82.9 /100 | #141 | Excellent 11.9% |
| Immigrants | Zimbabwe | 81.5 /100 | #142 | Excellent 11.9% |
| Pakistanis | 81.3 /100 | #143 | Excellent 11.9% |
| Peruvians | 80.9 /100 | #144 | Excellent 11.9% |
| Croatians | 80.6 /100 | #145 | Excellent 11.9% |
| Immigrants | Grenada | 79.1 /100 | #146 | Good 11.9% |
| Poles | 78.6 /100 | #147 | Good 11.9% |
| Italians | 77.8 /100 | #148 | Good 11.9% |
| Immigrants | Oceania | 77.7 /100 | #149 | Good 11.9% |
| Immigrants | Portugal | 77.3 /100 | #150 | Good 11.9% |
| Czechs | 76.4 /100 | #151 | Good 11.9% |
| Immigrants | Hungary | 73.7 /100 | #152 | Good 11.9% |