Immigrants from Eritrea vs Immigrants from St. Vincent and the Grenadines Disability Age 35 to 64
COMPARE
Immigrants from Eritrea
Immigrants from St. Vincent and the Grenadines
Disability Age 35 to 64
Disability Age 35 to 64 Comparison
Immigrants from Eritrea
Immigrants from St. Vincent and the Grenadines
10.9%
DISABILITY AGE 35 TO 64
83.4/ 100
METRIC RATING
147th/ 347
METRIC RANK
11.1%
DISABILITY AGE 35 TO 64
66.6/ 100
METRIC RATING
163rd/ 347
METRIC RANK
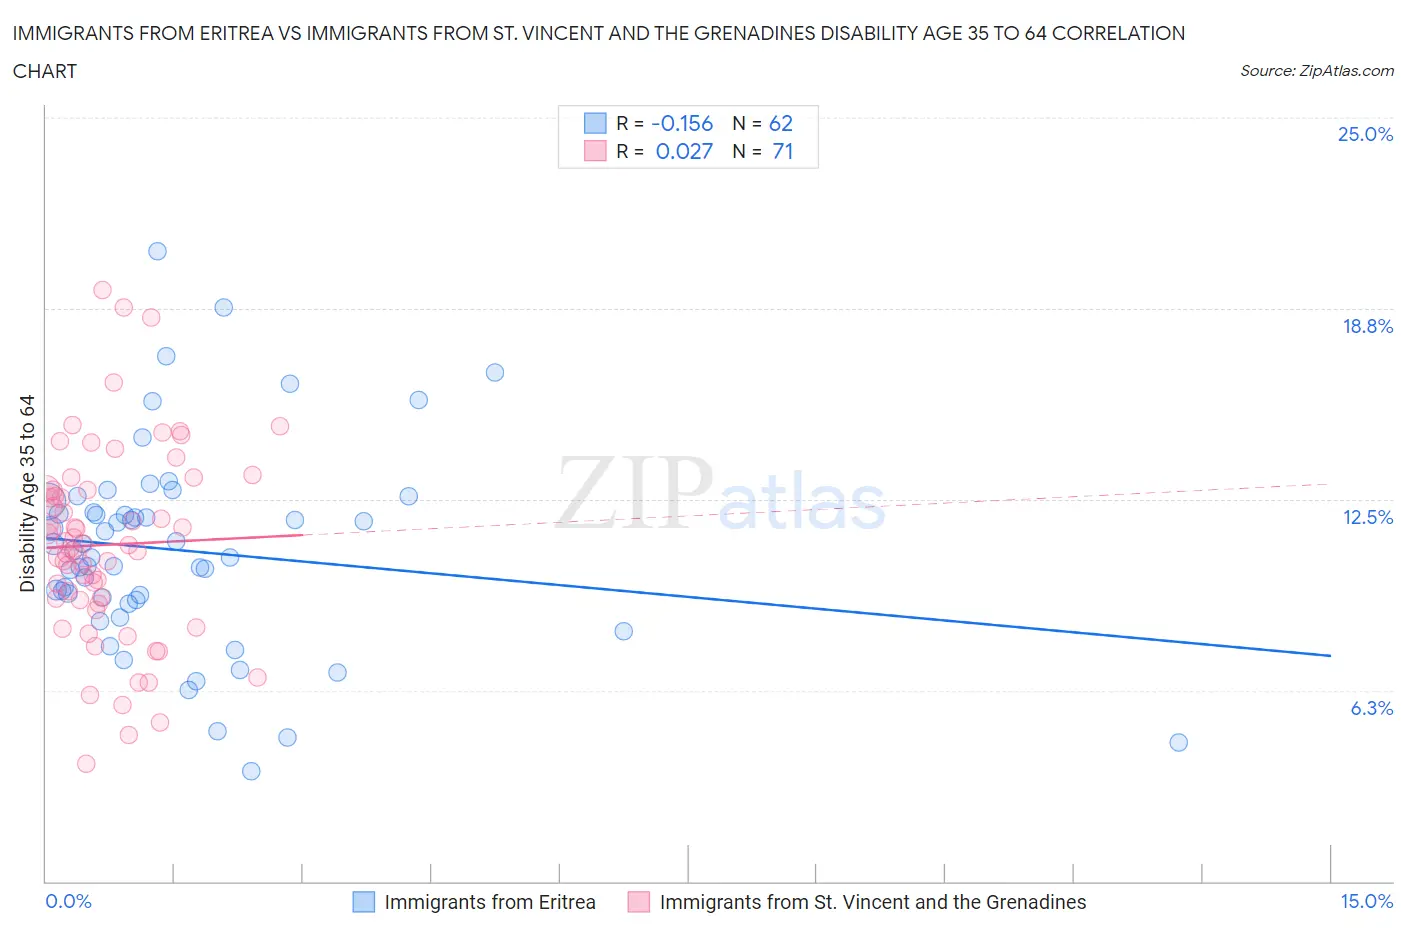
Immigrants from Eritrea vs Immigrants from St. Vincent and the Grenadines Disability Age 35 to 64 Correlation Chart
The statistical analysis conducted on geographies consisting of 104,841,301 people shows a poor negative correlation between the proportion of Immigrants from Eritrea and percentage of population with a disability between the ages 34 and 64 in the United States with a correlation coefficient (R) of -0.156 and weighted average of 10.9%. Similarly, the statistical analysis conducted on geographies consisting of 56,186,452 people shows no correlation between the proportion of Immigrants from St. Vincent and the Grenadines and percentage of population with a disability between the ages 34 and 64 in the United States with a correlation coefficient (R) of 0.027 and weighted average of 11.1%, a difference of 1.9%.
Disability Age 35 to 64 Correlation Summary
| Measurement | Immigrants from Eritrea | Immigrants from St. Vincent and the Grenadines |
| Minimum | 3.6% | 3.9% |
| Maximum | 20.6% | 19.3% |
| Range | 17.0% | 15.5% |
| Mean | 10.8% | 11.0% |
| Median | 10.7% | 11.0% |
| Interquartile 25% (IQ1) | 9.2% | 9.2% |
| Interquartile 75% (IQ3) | 12.1% | 12.8% |
| Interquartile Range (IQR) | 2.9% | 3.6% |
| Standard Deviation (Sample) | 3.3% | 3.1% |
| Standard Deviation (Population) | 3.3% | 3.1% |
Demographics Similar to Immigrants from Eritrea and Immigrants from St. Vincent and the Grenadines by Disability Age 35 to 64
In terms of disability age 35 to 64, the demographic groups most similar to Immigrants from Eritrea are South American Indian (10.9%, a difference of 0.020%), Arab (10.9%, a difference of 0.10%), Immigrants from Cameroon (10.9%, a difference of 0.32%), Immigrants from Bangladesh (10.9%, a difference of 0.36%), and Syrian (11.0%, a difference of 0.49%). Similarly, the demographic groups most similar to Immigrants from St. Vincent and the Grenadines are Pakistani (11.1%, a difference of 0.080%), Immigrants from Western Europe (11.1%, a difference of 0.13%), Immigrants from Grenada (11.1%, a difference of 0.16%), Immigrants from Guyana (11.1%, a difference of 0.33%), and Croatian (11.0%, a difference of 0.63%).
| Demographics | Rating | Rank | Disability Age 35 to 64 |
| Immigrants | Bangladesh | 85.6 /100 | #145 | Excellent 10.9% |
| South American Indians | 83.5 /100 | #146 | Excellent 10.9% |
| Immigrants | Eritrea | 83.4 /100 | #147 | Excellent 10.9% |
| Arabs | 82.7 /100 | #148 | Excellent 10.9% |
| Immigrants | Cameroon | 81.1 /100 | #149 | Excellent 10.9% |
| Syrians | 79.8 /100 | #150 | Good 11.0% |
| New Zealanders | 79.3 /100 | #151 | Good 11.0% |
| Ukrainians | 78.0 /100 | #152 | Good 11.0% |
| Immigrants | England | 77.4 /100 | #153 | Good 11.0% |
| Immigrants | Canada | 76.7 /100 | #154 | Good 11.0% |
| Moroccans | 76.4 /100 | #155 | Good 11.0% |
| Immigrants | Sierra Leone | 76.2 /100 | #156 | Good 11.0% |
| Guyanese | 75.1 /100 | #157 | Good 11.0% |
| Immigrants | North America | 74.9 /100 | #158 | Good 11.0% |
| Serbians | 73.6 /100 | #159 | Good 11.0% |
| Croatians | 73.1 /100 | #160 | Good 11.0% |
| Immigrants | Guyana | 70.1 /100 | #161 | Good 11.1% |
| Immigrants | Grenada | 68.4 /100 | #162 | Good 11.1% |
| Immigrants | St. Vincent and the Grenadines | 66.6 /100 | #163 | Good 11.1% |
| Pakistanis | 65.8 /100 | #164 | Good 11.1% |
| Immigrants | Western Europe | 65.2 /100 | #165 | Good 11.1% |