Immigrants from Eritrea vs Immigrants from St. Vincent and the Grenadines Family Poverty
COMPARE
Immigrants from Eritrea
Immigrants from St. Vincent and the Grenadines
Family Poverty
Family Poverty Comparison
Immigrants from Eritrea
Immigrants from St. Vincent and the Grenadines
9.9%
FAMILY POVERTY
5.4/ 100
METRIC RATING
219th/ 347
METRIC RANK
11.6%
FAMILY POVERTY
0.0/ 100
METRIC RATING
294th/ 347
METRIC RANK
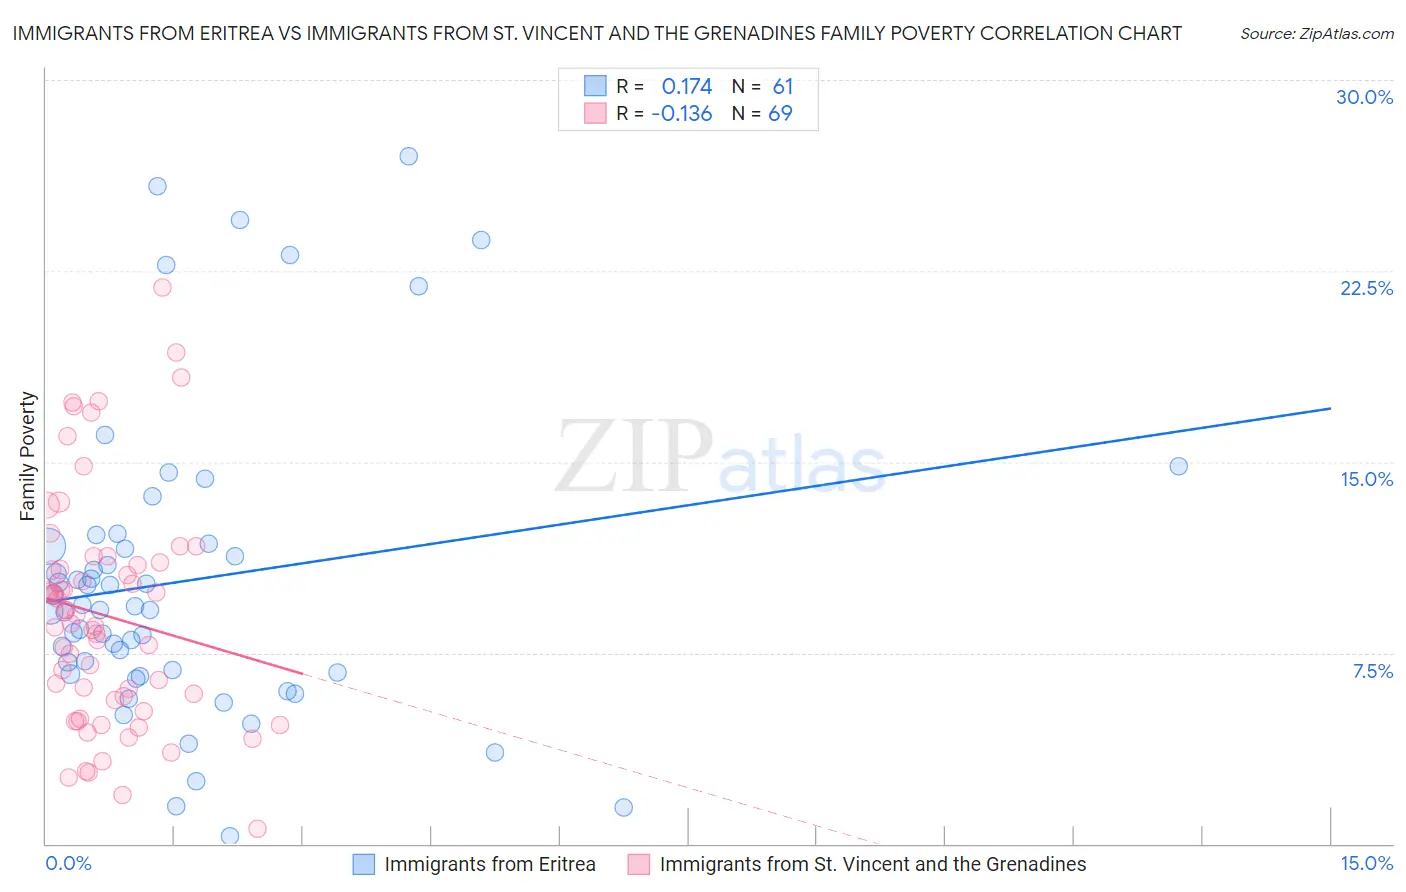
Immigrants from Eritrea vs Immigrants from St. Vincent and the Grenadines Family Poverty Correlation Chart
The statistical analysis conducted on geographies consisting of 104,784,674 people shows a poor positive correlation between the proportion of Immigrants from Eritrea and poverty level among families in the United States with a correlation coefficient (R) of 0.174 and weighted average of 9.9%. Similarly, the statistical analysis conducted on geographies consisting of 56,084,052 people shows a poor negative correlation between the proportion of Immigrants from St. Vincent and the Grenadines and poverty level among families in the United States with a correlation coefficient (R) of -0.136 and weighted average of 11.6%, a difference of 17.8%.
Family Poverty Correlation Summary
| Measurement | Immigrants from Eritrea | Immigrants from St. Vincent and the Grenadines |
| Minimum | 0.28% | 0.61% |
| Maximum | 27.0% | 21.9% |
| Range | 26.7% | 21.2% |
| Mean | 10.3% | 9.0% |
| Median | 9.2% | 8.6% |
| Interquartile 25% (IQ1) | 6.7% | 5.4% |
| Interquartile 75% (IQ3) | 11.7% | 11.0% |
| Interquartile Range (IQR) | 5.0% | 5.6% |
| Standard Deviation (Sample) | 6.0% | 4.5% |
| Standard Deviation (Population) | 5.9% | 4.5% |
Similar Demographics by Family Poverty
Demographics Similar to Immigrants from Eritrea by Family Poverty
In terms of family poverty, the demographic groups most similar to Immigrants from Eritrea are Bermudan (9.9%, a difference of 0.060%), Panamanian (9.8%, a difference of 0.13%), Immigrants from Cambodia (9.9%, a difference of 0.33%), Japanese (9.9%, a difference of 0.36%), and American (9.8%, a difference of 0.44%).
| Demographics | Rating | Rank | Family Poverty |
| Immigrants | Thailand | 9.7 /100 | #212 | Tragic 9.7% |
| Osage | 8.0 /100 | #213 | Tragic 9.7% |
| Immigrants | Micronesia | 6.7 /100 | #214 | Tragic 9.8% |
| Immigrants | Nonimmigrants | 6.7 /100 | #215 | Tragic 9.8% |
| Moroccans | 6.5 /100 | #216 | Tragic 9.8% |
| Americans | 6.2 /100 | #217 | Tragic 9.8% |
| Panamanians | 5.6 /100 | #218 | Tragic 9.8% |
| Immigrants | Eritrea | 5.4 /100 | #219 | Tragic 9.9% |
| Bermudans | 5.3 /100 | #220 | Tragic 9.9% |
| Immigrants | Cambodia | 4.8 /100 | #221 | Tragic 9.9% |
| Japanese | 4.8 /100 | #222 | Tragic 9.9% |
| Immigrants | Africa | 4.3 /100 | #223 | Tragic 9.9% |
| Marshallese | 3.9 /100 | #224 | Tragic 9.9% |
| Immigrants | Immigrants | 3.6 /100 | #225 | Tragic 10.0% |
| Ottawa | 3.3 /100 | #226 | Tragic 10.0% |
Demographics Similar to Immigrants from St. Vincent and the Grenadines by Family Poverty
In terms of family poverty, the demographic groups most similar to Immigrants from St. Vincent and the Grenadines are Immigrants from Cabo Verde (11.6%, a difference of 0.080%), Immigrants from Haiti (11.6%, a difference of 0.12%), Choctaw (11.6%, a difference of 0.17%), Creek (11.7%, a difference of 0.41%), and Immigrants from Somalia (11.5%, a difference of 0.51%).
| Demographics | Rating | Rank | Family Poverty |
| Vietnamese | 0.0 /100 | #287 | Tragic 11.5% |
| Immigrants | Belize | 0.0 /100 | #288 | Tragic 11.5% |
| Immigrants | Barbados | 0.0 /100 | #289 | Tragic 11.5% |
| West Indians | 0.0 /100 | #290 | Tragic 11.5% |
| Haitians | 0.0 /100 | #291 | Tragic 11.5% |
| Immigrants | Somalia | 0.0 /100 | #292 | Tragic 11.5% |
| Immigrants | Cabo Verde | 0.0 /100 | #293 | Tragic 11.6% |
| Immigrants | St. Vincent and the Grenadines | 0.0 /100 | #294 | Tragic 11.6% |
| Immigrants | Haiti | 0.0 /100 | #295 | Tragic 11.6% |
| Choctaw | 0.0 /100 | #296 | Tragic 11.6% |
| Creek | 0.0 /100 | #297 | Tragic 11.7% |
| Immigrants | Senegal | 0.0 /100 | #298 | Tragic 11.7% |
| Dutch West Indians | 0.0 /100 | #299 | Tragic 11.7% |
| Immigrants | Bangladesh | 0.0 /100 | #300 | Tragic 11.7% |
| Bahamians | 0.0 /100 | #301 | Tragic 11.7% |