Immigrants from Egypt vs Immigrants from Belarus 2 or more Vehicles in Household
COMPARE
Immigrants from Egypt
Immigrants from Belarus
2 or more Vehicles in Household
2 or more Vehicles in Household Comparison
Immigrants from Egypt
Immigrants from Belarus
53.8%
2 OR MORE VEHICLES IN HOUSEHOLD
5.2/ 100
METRIC RATING
225th/ 347
METRIC RANK
47.9%
2 OR MORE VEHICLES IN HOUSEHOLD
0.0/ 100
METRIC RATING
311th/ 347
METRIC RANK
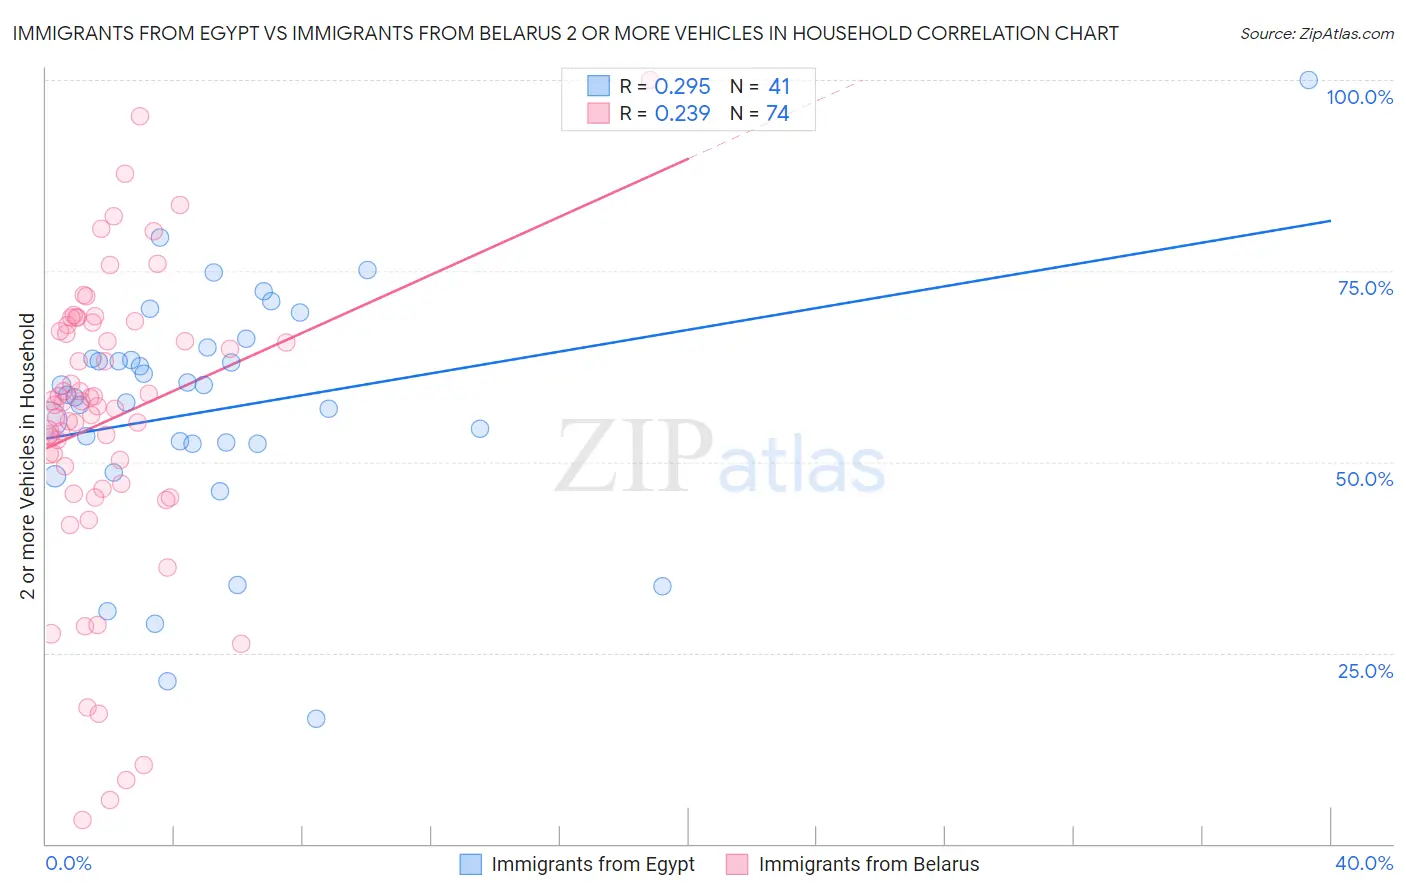
Immigrants from Egypt vs Immigrants from Belarus 2 or more Vehicles in Household Correlation Chart
The statistical analysis conducted on geographies consisting of 245,432,298 people shows a weak positive correlation between the proportion of Immigrants from Egypt and percentage of households with 2 or more vehicles available in the United States with a correlation coefficient (R) of 0.295 and weighted average of 53.8%. Similarly, the statistical analysis conducted on geographies consisting of 150,189,140 people shows a weak positive correlation between the proportion of Immigrants from Belarus and percentage of households with 2 or more vehicles available in the United States with a correlation coefficient (R) of 0.239 and weighted average of 47.9%, a difference of 12.2%.
2 or more Vehicles in Household Correlation Summary
| Measurement | Immigrants from Egypt | Immigrants from Belarus |
| Minimum | 16.3% | 3.0% |
| Maximum | 100.0% | 100.0% |
| Range | 83.7% | 97.0% |
| Mean | 56.9% | 55.5% |
| Median | 58.8% | 57.6% |
| Interquartile 25% (IQ1) | 52.4% | 47.1% |
| Interquartile 75% (IQ3) | 64.2% | 67.9% |
| Interquartile Range (IQR) | 11.8% | 20.9% |
| Standard Deviation (Sample) | 15.9% | 19.6% |
| Standard Deviation (Population) | 15.7% | 19.4% |
Similar Demographics by 2 or more Vehicles in Household
Demographics Similar to Immigrants from Egypt by 2 or more Vehicles in Household
In terms of 2 or more vehicles in household, the demographic groups most similar to Immigrants from Egypt are Brazilian (53.8%, a difference of 0.010%), Immigrants from Eastern Africa (53.7%, a difference of 0.020%), Immigrants from Bosnia and Herzegovina (53.8%, a difference of 0.050%), Kiowa (53.9%, a difference of 0.18%), and Immigrants from Singapore (53.9%, a difference of 0.20%).
| Demographics | Rating | Rank | 2 or more Vehicles in Household |
| Immigrants | Argentina | 6.8 /100 | #218 | Tragic 53.9% |
| South American Indians | 6.5 /100 | #219 | Tragic 53.9% |
| Taiwanese | 6.3 /100 | #220 | Tragic 53.9% |
| Immigrants | Singapore | 6.3 /100 | #221 | Tragic 53.9% |
| Kiowa | 6.2 /100 | #222 | Tragic 53.9% |
| Immigrants | Bosnia and Herzegovina | 5.5 /100 | #223 | Tragic 53.8% |
| Brazilians | 5.3 /100 | #224 | Tragic 53.8% |
| Immigrants | Egypt | 5.2 /100 | #225 | Tragic 53.8% |
| Immigrants | Eastern Africa | 5.1 /100 | #226 | Tragic 53.7% |
| Sudanese | 4.1 /100 | #227 | Tragic 53.6% |
| Alaska Natives | 3.9 /100 | #228 | Tragic 53.6% |
| Immigrants | Turkey | 3.8 /100 | #229 | Tragic 53.6% |
| Immigrants | Nepal | 3.6 /100 | #230 | Tragic 53.5% |
| Panamanians | 3.4 /100 | #231 | Tragic 53.5% |
| Immigrants | Guatemala | 3.2 /100 | #232 | Tragic 53.5% |
Demographics Similar to Immigrants from Belarus by 2 or more Vehicles in Household
In terms of 2 or more vehicles in household, the demographic groups most similar to Immigrants from Belarus are Ghanaian (48.0%, a difference of 0.12%), Haitian (47.6%, a difference of 0.74%), U.S. Virgin Islander (47.5%, a difference of 0.91%), Immigrants from Ghana (47.4%, a difference of 1.1%), and Puerto Rican (47.1%, a difference of 1.7%).
| Demographics | Rating | Rank | 2 or more Vehicles in Household |
| Immigrants | Belize | 0.0 /100 | #304 | Tragic 49.9% |
| Immigrants | Western Africa | 0.0 /100 | #305 | Tragic 49.4% |
| Immigrants | Israel | 0.0 /100 | #306 | Tragic 49.2% |
| Hopi | 0.0 /100 | #307 | Tragic 49.0% |
| Albanians | 0.0 /100 | #308 | Tragic 49.0% |
| Moroccans | 0.0 /100 | #309 | Tragic 48.8% |
| Ghanaians | 0.0 /100 | #310 | Tragic 48.0% |
| Immigrants | Belarus | 0.0 /100 | #311 | Tragic 47.9% |
| Haitians | 0.0 /100 | #312 | Tragic 47.6% |
| U.S. Virgin Islanders | 0.0 /100 | #313 | Tragic 47.5% |
| Immigrants | Ghana | 0.0 /100 | #314 | Tragic 47.4% |
| Puerto Ricans | 0.0 /100 | #315 | Tragic 47.1% |
| Cape Verdeans | 0.0 /100 | #316 | Tragic 46.8% |
| Immigrants | Haiti | 0.0 /100 | #317 | Tragic 46.5% |
| Immigrants | Albania | 0.0 /100 | #318 | Tragic 46.0% |