Immigrants from Ecuador vs Immigrants from Armenia 1 or more Vehicles in Household
COMPARE
Immigrants from Ecuador
Immigrants from Armenia
1 or more Vehicles in Household
1 or more Vehicles in Household Comparison
Immigrants from Ecuador
Immigrants from Armenia
76.2%
1 OR MORE VEHICLES IN HOUSEHOLD
0.0/ 100
METRIC RATING
333rd/ 347
METRIC RANK
89.4%
1 OR MORE VEHICLES IN HOUSEHOLD
31.8/ 100
METRIC RATING
195th/ 347
METRIC RANK
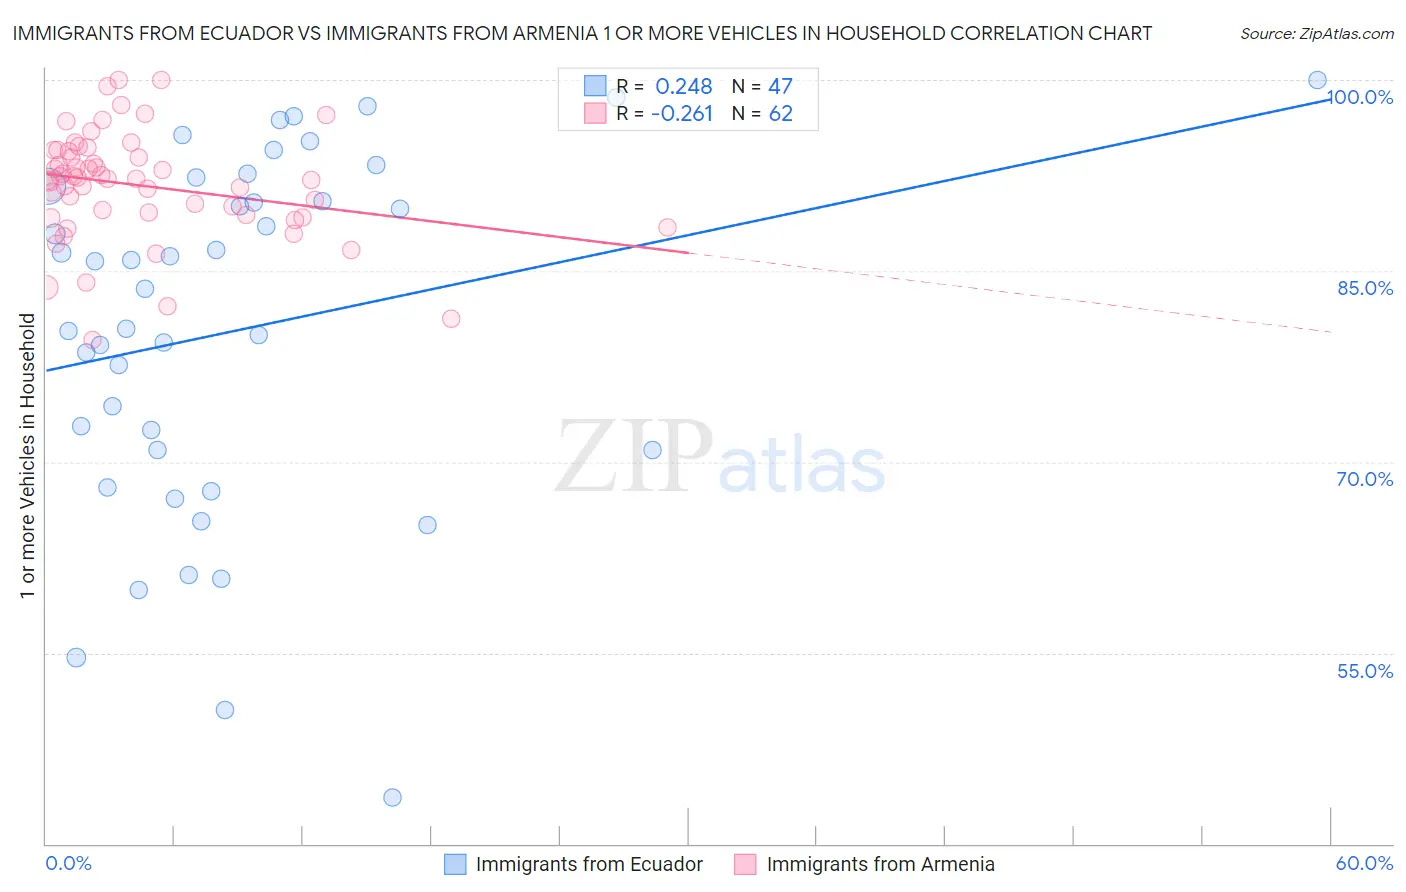
Immigrants from Ecuador vs Immigrants from Armenia 1 or more Vehicles in Household Correlation Chart
The statistical analysis conducted on geographies consisting of 270,903,190 people shows a weak positive correlation between the proportion of Immigrants from Ecuador and percentage of households with 1 or more vehicles available in the United States with a correlation coefficient (R) of 0.248 and weighted average of 76.2%. Similarly, the statistical analysis conducted on geographies consisting of 97,564,455 people shows a weak negative correlation between the proportion of Immigrants from Armenia and percentage of households with 1 or more vehicles available in the United States with a correlation coefficient (R) of -0.261 and weighted average of 89.4%, a difference of 17.3%.
1 or more Vehicles in Household Correlation Summary
| Measurement | Immigrants from Ecuador | Immigrants from Armenia |
| Minimum | 43.6% | 79.5% |
| Maximum | 100.0% | 100.0% |
| Range | 56.4% | 20.5% |
| Mean | 80.4% | 91.7% |
| Median | 83.6% | 92.3% |
| Interquartile 25% (IQ1) | 70.9% | 89.4% |
| Interquartile 75% (IQ3) | 91.7% | 94.4% |
| Interquartile Range (IQR) | 20.7% | 5.0% |
| Standard Deviation (Sample) | 13.9% | 4.2% |
| Standard Deviation (Population) | 13.7% | 4.2% |
Similar Demographics by 1 or more Vehicles in Household
Demographics Similar to Immigrants from Ecuador by 1 or more Vehicles in Household
In terms of 1 or more vehicles in household, the demographic groups most similar to Immigrants from Ecuador are Trinidadian and Tobagonian (76.3%, a difference of 0.10%), West Indian (76.4%, a difference of 0.18%), Immigrants from Trinidad and Tobago (76.8%, a difference of 0.73%), Immigrants from Dominica (77.8%, a difference of 2.1%), and Ecuadorian (77.9%, a difference of 2.2%).
| Demographics | Rating | Rank | 1 or more Vehicles in Household |
| Immigrants | West Indies | 0.0 /100 | #326 | Tragic 79.5% |
| Immigrants | Senegal | 0.0 /100 | #327 | Tragic 79.0% |
| Ecuadorians | 0.0 /100 | #328 | Tragic 77.9% |
| Immigrants | Dominica | 0.0 /100 | #329 | Tragic 77.8% |
| Immigrants | Trinidad and Tobago | 0.0 /100 | #330 | Tragic 76.8% |
| West Indians | 0.0 /100 | #331 | Tragic 76.4% |
| Trinidadians and Tobagonians | 0.0 /100 | #332 | Tragic 76.3% |
| Immigrants | Ecuador | 0.0 /100 | #333 | Tragic 76.2% |
| Immigrants | Bangladesh | 0.0 /100 | #334 | Tragic 74.3% |
| Barbadians | 0.0 /100 | #335 | Tragic 74.0% |
| Vietnamese | 0.0 /100 | #336 | Tragic 73.8% |
| Immigrants | Uzbekistan | 0.0 /100 | #337 | Tragic 73.4% |
| Inupiat | 0.0 /100 | #338 | Tragic 71.5% |
| Guyanese | 0.0 /100 | #339 | Tragic 70.8% |
| Dominicans | 0.0 /100 | #340 | Tragic 70.7% |
Demographics Similar to Immigrants from Armenia by 1 or more Vehicles in Household
In terms of 1 or more vehicles in household, the demographic groups most similar to Immigrants from Armenia are Immigrants from Eritrea (89.4%, a difference of 0.020%), Immigrants from Northern Europe (89.5%, a difference of 0.060%), Immigrants from North Macedonia (89.5%, a difference of 0.080%), Immigrants from Poland (89.5%, a difference of 0.090%), and Carpatho Rusyn (89.5%, a difference of 0.10%).
| Demographics | Rating | Rank | 1 or more Vehicles in Household |
| Immigrants | Nepal | 38.9 /100 | #188 | Fair 89.5% |
| Carpatho Rusyns | 37.8 /100 | #189 | Fair 89.5% |
| Shoshone | 37.5 /100 | #190 | Fair 89.5% |
| Immigrants | Poland | 37.1 /100 | #191 | Fair 89.5% |
| Immigrants | North Macedonia | 36.5 /100 | #192 | Fair 89.5% |
| Immigrants | Northern Europe | 35.5 /100 | #193 | Fair 89.5% |
| Immigrants | Eritrea | 33.2 /100 | #194 | Fair 89.4% |
| Immigrants | Armenia | 31.8 /100 | #195 | Fair 89.4% |
| Crow | 24.3 /100 | #196 | Fair 89.3% |
| Immigrants | Sweden | 23.6 /100 | #197 | Fair 89.3% |
| Pennsylvania Germans | 22.9 /100 | #198 | Fair 89.3% |
| Immigrants | Asia | 22.8 /100 | #199 | Fair 89.3% |
| Central Americans | 21.4 /100 | #200 | Fair 89.2% |
| Immigrants | Western Europe | 20.5 /100 | #201 | Fair 89.2% |
| Iroquois | 19.8 /100 | #202 | Poor 89.2% |