Immigrants from Zaire vs Immigrants from Armenia 1 or more Vehicles in Household
COMPARE
Immigrants from Zaire
Immigrants from Armenia
1 or more Vehicles in Household
1 or more Vehicles in Household Comparison
Immigrants from Zaire
Immigrants from Armenia
88.8%
1 OR MORE VEHICLES IN HOUSEHOLD
8.1/ 100
METRIC RATING
220th/ 347
METRIC RANK
89.4%
1 OR MORE VEHICLES IN HOUSEHOLD
31.8/ 100
METRIC RATING
195th/ 347
METRIC RANK
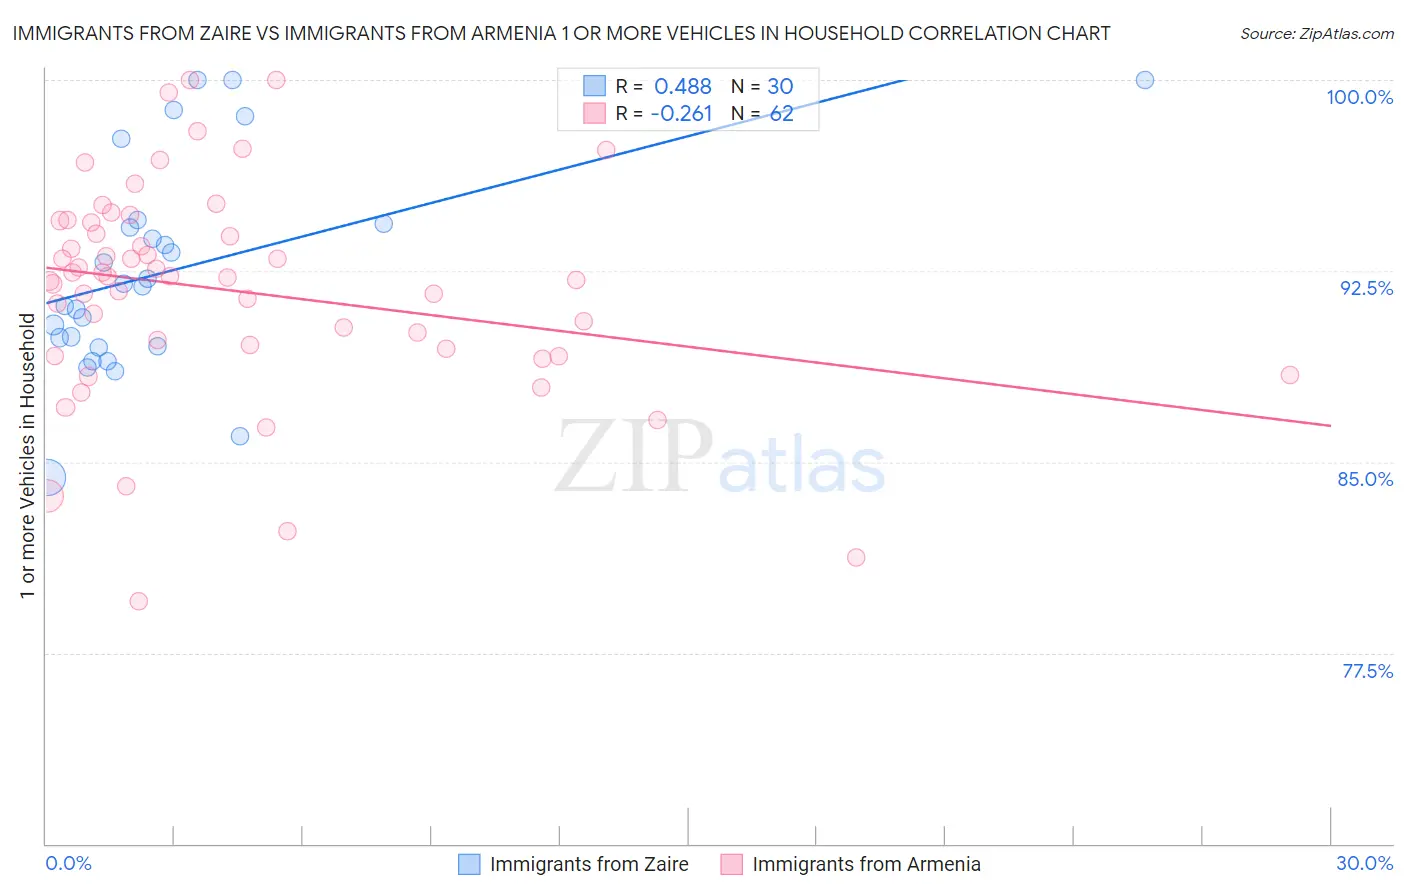
Immigrants from Zaire vs Immigrants from Armenia 1 or more Vehicles in Household Correlation Chart
The statistical analysis conducted on geographies consisting of 107,246,664 people shows a moderate positive correlation between the proportion of Immigrants from Zaire and percentage of households with 1 or more vehicles available in the United States with a correlation coefficient (R) of 0.488 and weighted average of 88.8%. Similarly, the statistical analysis conducted on geographies consisting of 97,564,455 people shows a weak negative correlation between the proportion of Immigrants from Armenia and percentage of households with 1 or more vehicles available in the United States with a correlation coefficient (R) of -0.261 and weighted average of 89.4%, a difference of 0.65%.
1 or more Vehicles in Household Correlation Summary
| Measurement | Immigrants from Zaire | Immigrants from Armenia |
| Minimum | 84.4% | 79.5% |
| Maximum | 100.0% | 100.0% |
| Range | 15.6% | 20.5% |
| Mean | 92.5% | 91.7% |
| Median | 91.9% | 92.3% |
| Interquartile 25% (IQ1) | 89.6% | 89.4% |
| Interquartile 75% (IQ3) | 94.4% | 94.4% |
| Interquartile Range (IQR) | 4.8% | 5.0% |
| Standard Deviation (Sample) | 4.1% | 4.2% |
| Standard Deviation (Population) | 4.1% | 4.2% |
Similar Demographics by 1 or more Vehicles in Household
Demographics Similar to Immigrants from Zaire by 1 or more Vehicles in Household
In terms of 1 or more vehicles in household, the demographic groups most similar to Immigrants from Zaire are Peruvian (88.8%, a difference of 0.010%), Ugandan (88.9%, a difference of 0.030%), Immigrants from Guatemala (88.9%, a difference of 0.030%), Argentinean (88.9%, a difference of 0.040%), and Immigrants from Argentina (88.9%, a difference of 0.070%).
| Demographics | Rating | Rank | 1 or more Vehicles in Household |
| Immigrants | Western Asia | 12.3 /100 | #213 | Poor 89.0% |
| Immigrants | Hungary | 11.9 /100 | #214 | Poor 89.0% |
| Immigrants | Sri Lanka | 10.2 /100 | #215 | Poor 88.9% |
| Immigrants | Argentina | 9.4 /100 | #216 | Tragic 88.9% |
| Argentineans | 8.8 /100 | #217 | Tragic 88.9% |
| Ugandans | 8.7 /100 | #218 | Tragic 88.9% |
| Immigrants | Guatemala | 8.6 /100 | #219 | Tragic 88.9% |
| Immigrants | Zaire | 8.1 /100 | #220 | Tragic 88.8% |
| Peruvians | 7.9 /100 | #221 | Tragic 88.8% |
| Uruguayans | 7.0 /100 | #222 | Tragic 88.8% |
| Immigrants | South America | 7.0 /100 | #223 | Tragic 88.8% |
| Immigrants | Hong Kong | 6.2 /100 | #224 | Tragic 88.7% |
| Cree | 6.0 /100 | #225 | Tragic 88.7% |
| Cheyenne | 5.7 /100 | #226 | Tragic 88.7% |
| Ute | 5.6 /100 | #227 | Tragic 88.7% |
Demographics Similar to Immigrants from Armenia by 1 or more Vehicles in Household
In terms of 1 or more vehicles in household, the demographic groups most similar to Immigrants from Armenia are Immigrants from Eritrea (89.4%, a difference of 0.020%), Immigrants from Northern Europe (89.5%, a difference of 0.060%), Immigrants from North Macedonia (89.5%, a difference of 0.080%), Immigrants from Poland (89.5%, a difference of 0.090%), and Carpatho Rusyn (89.5%, a difference of 0.10%).
| Demographics | Rating | Rank | 1 or more Vehicles in Household |
| Immigrants | Nepal | 38.9 /100 | #188 | Fair 89.5% |
| Carpatho Rusyns | 37.8 /100 | #189 | Fair 89.5% |
| Shoshone | 37.5 /100 | #190 | Fair 89.5% |
| Immigrants | Poland | 37.1 /100 | #191 | Fair 89.5% |
| Immigrants | North Macedonia | 36.5 /100 | #192 | Fair 89.5% |
| Immigrants | Northern Europe | 35.5 /100 | #193 | Fair 89.5% |
| Immigrants | Eritrea | 33.2 /100 | #194 | Fair 89.4% |
| Immigrants | Armenia | 31.8 /100 | #195 | Fair 89.4% |
| Crow | 24.3 /100 | #196 | Fair 89.3% |
| Immigrants | Sweden | 23.6 /100 | #197 | Fair 89.3% |
| Pennsylvania Germans | 22.9 /100 | #198 | Fair 89.3% |
| Immigrants | Asia | 22.8 /100 | #199 | Fair 89.3% |
| Central Americans | 21.4 /100 | #200 | Fair 89.2% |
| Immigrants | Western Europe | 20.5 /100 | #201 | Fair 89.2% |
| Iroquois | 19.8 /100 | #202 | Poor 89.2% |