Immigrants from Ecuador vs Nonimmigrants 1 or more Vehicles in Household
COMPARE
Immigrants from Ecuador
Nonimmigrants
1 or more Vehicles in Household
1 or more Vehicles in Household Comparison
Immigrants from Ecuador
Nonimmigrants
76.2%
1 OR MORE VEHICLES IN HOUSEHOLD
0.0/ 100
METRIC RATING
333rd/ 347
METRIC RANK
92.2%
1 OR MORE VEHICLES IN HOUSEHOLD
99.9/ 100
METRIC RATING
45th/ 347
METRIC RANK
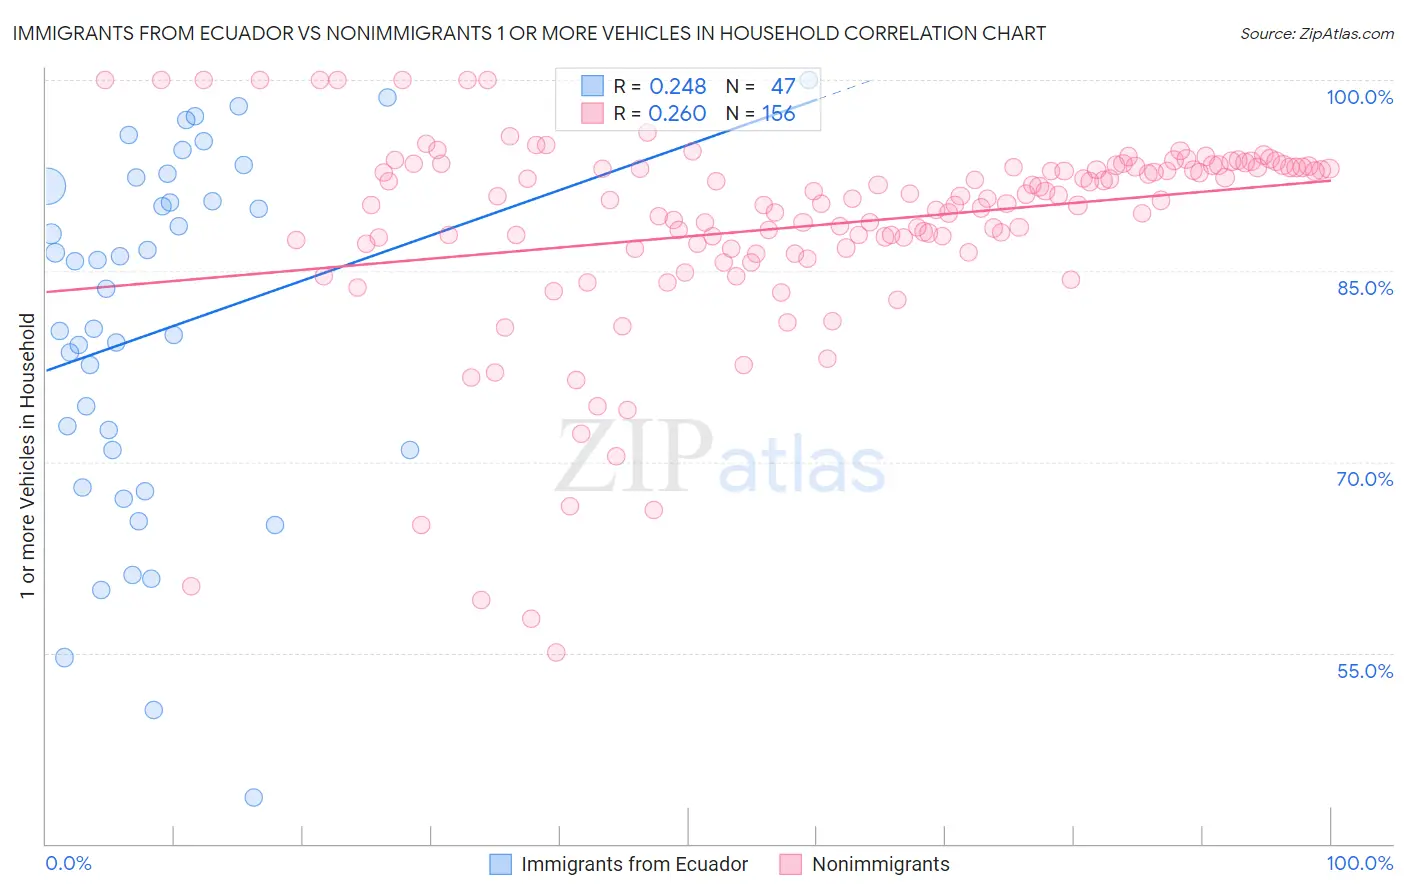
Immigrants from Ecuador vs Nonimmigrants 1 or more Vehicles in Household Correlation Chart
The statistical analysis conducted on geographies consisting of 270,903,190 people shows a weak positive correlation between the proportion of Immigrants from Ecuador and percentage of households with 1 or more vehicles available in the United States with a correlation coefficient (R) of 0.248 and weighted average of 76.2%. Similarly, the statistical analysis conducted on geographies consisting of 574,303,261 people shows a weak positive correlation between the proportion of Nonimmigrants and percentage of households with 1 or more vehicles available in the United States with a correlation coefficient (R) of 0.260 and weighted average of 92.2%, a difference of 21.0%.
1 or more Vehicles in Household Correlation Summary
| Measurement | Immigrants from Ecuador | Nonimmigrants |
| Minimum | 43.6% | 55.0% |
| Maximum | 100.0% | 100.0% |
| Range | 56.4% | 45.0% |
| Mean | 80.4% | 88.6% |
| Median | 83.6% | 90.6% |
| Interquartile 25% (IQ1) | 70.9% | 87.0% |
| Interquartile 75% (IQ3) | 91.7% | 93.2% |
| Interquartile Range (IQR) | 20.7% | 6.2% |
| Standard Deviation (Sample) | 13.9% | 8.1% |
| Standard Deviation (Population) | 13.7% | 8.0% |
Similar Demographics by 1 or more Vehicles in Household
Demographics Similar to Immigrants from Ecuador by 1 or more Vehicles in Household
In terms of 1 or more vehicles in household, the demographic groups most similar to Immigrants from Ecuador are Trinidadian and Tobagonian (76.3%, a difference of 0.10%), West Indian (76.4%, a difference of 0.18%), Immigrants from Trinidad and Tobago (76.8%, a difference of 0.73%), Immigrants from Dominica (77.8%, a difference of 2.1%), and Ecuadorian (77.9%, a difference of 2.2%).
| Demographics | Rating | Rank | 1 or more Vehicles in Household |
| Immigrants | West Indies | 0.0 /100 | #326 | Tragic 79.5% |
| Immigrants | Senegal | 0.0 /100 | #327 | Tragic 79.0% |
| Ecuadorians | 0.0 /100 | #328 | Tragic 77.9% |
| Immigrants | Dominica | 0.0 /100 | #329 | Tragic 77.8% |
| Immigrants | Trinidad and Tobago | 0.0 /100 | #330 | Tragic 76.8% |
| West Indians | 0.0 /100 | #331 | Tragic 76.4% |
| Trinidadians and Tobagonians | 0.0 /100 | #332 | Tragic 76.3% |
| Immigrants | Ecuador | 0.0 /100 | #333 | Tragic 76.2% |
| Immigrants | Bangladesh | 0.0 /100 | #334 | Tragic 74.3% |
| Barbadians | 0.0 /100 | #335 | Tragic 74.0% |
| Vietnamese | 0.0 /100 | #336 | Tragic 73.8% |
| Immigrants | Uzbekistan | 0.0 /100 | #337 | Tragic 73.4% |
| Inupiat | 0.0 /100 | #338 | Tragic 71.5% |
| Guyanese | 0.0 /100 | #339 | Tragic 70.8% |
| Dominicans | 0.0 /100 | #340 | Tragic 70.7% |
Demographics Similar to Nonimmigrants by 1 or more Vehicles in Household
In terms of 1 or more vehicles in household, the demographic groups most similar to Nonimmigrants are Choctaw (92.2%, a difference of 0.020%), Immigrants from Fiji (92.2%, a difference of 0.020%), Northern European (92.2%, a difference of 0.030%), Spanish (92.3%, a difference of 0.040%), and Immigrants from Taiwan (92.3%, a difference of 0.050%).
| Demographics | Rating | Rank | 1 or more Vehicles in Household |
| Immigrants | Vietnam | 99.9 /100 | #38 | Exceptional 92.3% |
| Swiss | 99.9 /100 | #39 | Exceptional 92.3% |
| Creek | 99.9 /100 | #40 | Exceptional 92.3% |
| Immigrants | Taiwan | 99.9 /100 | #41 | Exceptional 92.3% |
| Chickasaw | 99.9 /100 | #42 | Exceptional 92.3% |
| Spanish | 99.9 /100 | #43 | Exceptional 92.3% |
| Choctaw | 99.9 /100 | #44 | Exceptional 92.2% |
| Immigrants | Nonimmigrants | 99.9 /100 | #45 | Exceptional 92.2% |
| Immigrants | Fiji | 99.9 /100 | #46 | Exceptional 92.2% |
| Northern Europeans | 99.9 /100 | #47 | Exceptional 92.2% |
| Belgians | 99.9 /100 | #48 | Exceptional 92.1% |
| Afghans | 99.9 /100 | #49 | Exceptional 92.1% |
| Guamanians/Chamorros | 99.9 /100 | #50 | Exceptional 92.1% |
| Celtics | 99.9 /100 | #51 | Exceptional 92.1% |
| Koreans | 99.9 /100 | #52 | Exceptional 92.1% |