Immigrants from Philippines vs Immigrants from Armenia 1 or more Vehicles in Household
COMPARE
Immigrants from Philippines
Immigrants from Armenia
1 or more Vehicles in Household
1 or more Vehicles in Household Comparison
Immigrants from Philippines
Immigrants from Armenia
91.5%
1 OR MORE VEHICLES IN HOUSEHOLD
99.4/ 100
METRIC RATING
77th/ 347
METRIC RANK
89.4%
1 OR MORE VEHICLES IN HOUSEHOLD
31.8/ 100
METRIC RATING
195th/ 347
METRIC RANK
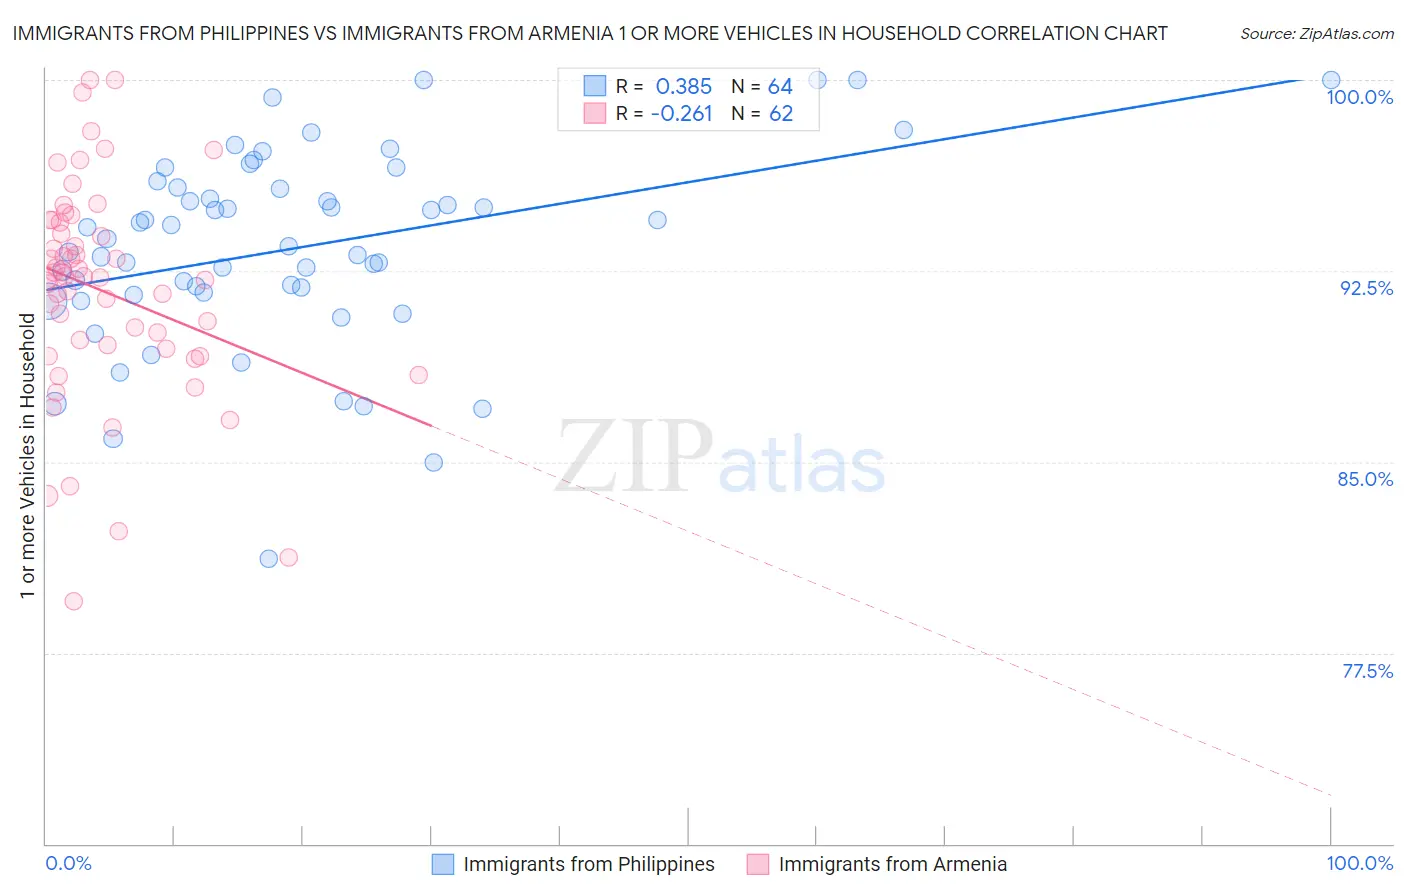
Immigrants from Philippines vs Immigrants from Armenia 1 or more Vehicles in Household Correlation Chart
The statistical analysis conducted on geographies consisting of 471,073,729 people shows a mild positive correlation between the proportion of Immigrants from Philippines and percentage of households with 1 or more vehicles available in the United States with a correlation coefficient (R) of 0.385 and weighted average of 91.5%. Similarly, the statistical analysis conducted on geographies consisting of 97,564,455 people shows a weak negative correlation between the proportion of Immigrants from Armenia and percentage of households with 1 or more vehicles available in the United States with a correlation coefficient (R) of -0.261 and weighted average of 89.4%, a difference of 2.3%.
1 or more Vehicles in Household Correlation Summary
| Measurement | Immigrants from Philippines | Immigrants from Armenia |
| Minimum | 81.2% | 79.5% |
| Maximum | 100.0% | 100.0% |
| Range | 18.8% | 20.5% |
| Mean | 93.4% | 91.7% |
| Median | 93.6% | 92.3% |
| Interquartile 25% (IQ1) | 91.6% | 89.4% |
| Interquartile 75% (IQ3) | 95.7% | 94.4% |
| Interquartile Range (IQR) | 4.1% | 5.0% |
| Standard Deviation (Sample) | 3.8% | 4.2% |
| Standard Deviation (Population) | 3.8% | 4.2% |
Similar Demographics by 1 or more Vehicles in Household
Demographics Similar to Immigrants from Philippines by 1 or more Vehicles in Household
In terms of 1 or more vehicles in household, the demographic groups most similar to Immigrants from Philippines are Iranian (91.5%, a difference of 0.0%), Immigrants from South Central Asia (91.5%, a difference of 0.020%), Bolivian (91.5%, a difference of 0.030%), Cuban (91.5%, a difference of 0.040%), and Portuguese (91.6%, a difference of 0.060%).
| Demographics | Rating | Rank | 1 or more Vehicles in Household |
| Lithuanians | 99.7 /100 | #70 | Exceptional 91.7% |
| Poles | 99.7 /100 | #71 | Exceptional 91.7% |
| Cajuns | 99.7 /100 | #72 | Exceptional 91.7% |
| Immigrants | Iran | 99.7 /100 | #73 | Exceptional 91.7% |
| Immigrants | Lebanon | 99.6 /100 | #74 | Exceptional 91.6% |
| Portuguese | 99.5 /100 | #75 | Exceptional 91.6% |
| Cubans | 99.5 /100 | #76 | Exceptional 91.5% |
| Immigrants | Philippines | 99.4 /100 | #77 | Exceptional 91.5% |
| Iranians | 99.4 /100 | #78 | Exceptional 91.5% |
| Immigrants | South Central Asia | 99.4 /100 | #79 | Exceptional 91.5% |
| Bolivians | 99.4 /100 | #80 | Exceptional 91.5% |
| Immigrants | South Eastern Asia | 99.3 /100 | #81 | Exceptional 91.4% |
| Lebanese | 99.3 /100 | #82 | Exceptional 91.4% |
| Immigrants | England | 99.3 /100 | #83 | Exceptional 91.4% |
| Jordanians | 99.3 /100 | #84 | Exceptional 91.4% |
Demographics Similar to Immigrants from Armenia by 1 or more Vehicles in Household
In terms of 1 or more vehicles in household, the demographic groups most similar to Immigrants from Armenia are Immigrants from Eritrea (89.4%, a difference of 0.020%), Immigrants from Northern Europe (89.5%, a difference of 0.060%), Immigrants from North Macedonia (89.5%, a difference of 0.080%), Immigrants from Poland (89.5%, a difference of 0.090%), and Carpatho Rusyn (89.5%, a difference of 0.10%).
| Demographics | Rating | Rank | 1 or more Vehicles in Household |
| Immigrants | Nepal | 38.9 /100 | #188 | Fair 89.5% |
| Carpatho Rusyns | 37.8 /100 | #189 | Fair 89.5% |
| Shoshone | 37.5 /100 | #190 | Fair 89.5% |
| Immigrants | Poland | 37.1 /100 | #191 | Fair 89.5% |
| Immigrants | North Macedonia | 36.5 /100 | #192 | Fair 89.5% |
| Immigrants | Northern Europe | 35.5 /100 | #193 | Fair 89.5% |
| Immigrants | Eritrea | 33.2 /100 | #194 | Fair 89.4% |
| Immigrants | Armenia | 31.8 /100 | #195 | Fair 89.4% |
| Crow | 24.3 /100 | #196 | Fair 89.3% |
| Immigrants | Sweden | 23.6 /100 | #197 | Fair 89.3% |
| Pennsylvania Germans | 22.9 /100 | #198 | Fair 89.3% |
| Immigrants | Asia | 22.8 /100 | #199 | Fair 89.3% |
| Central Americans | 21.4 /100 | #200 | Fair 89.2% |
| Immigrants | Western Europe | 20.5 /100 | #201 | Fair 89.2% |
| Iroquois | 19.8 /100 | #202 | Poor 89.2% |