Immigrants from Ecuador vs U.S. Virgin Islander 1 or more Vehicles in Household
COMPARE
Immigrants from Ecuador
U.S. Virgin Islander
1 or more Vehicles in Household
1 or more Vehicles in Household Comparison
Immigrants from Ecuador
U.S. Virgin Islanders
76.2%
1 OR MORE VEHICLES IN HOUSEHOLD
0.0/ 100
METRIC RATING
333rd/ 347
METRIC RANK
84.6%
1 OR MORE VEHICLES IN HOUSEHOLD
0.0/ 100
METRIC RATING
310th/ 347
METRIC RANK
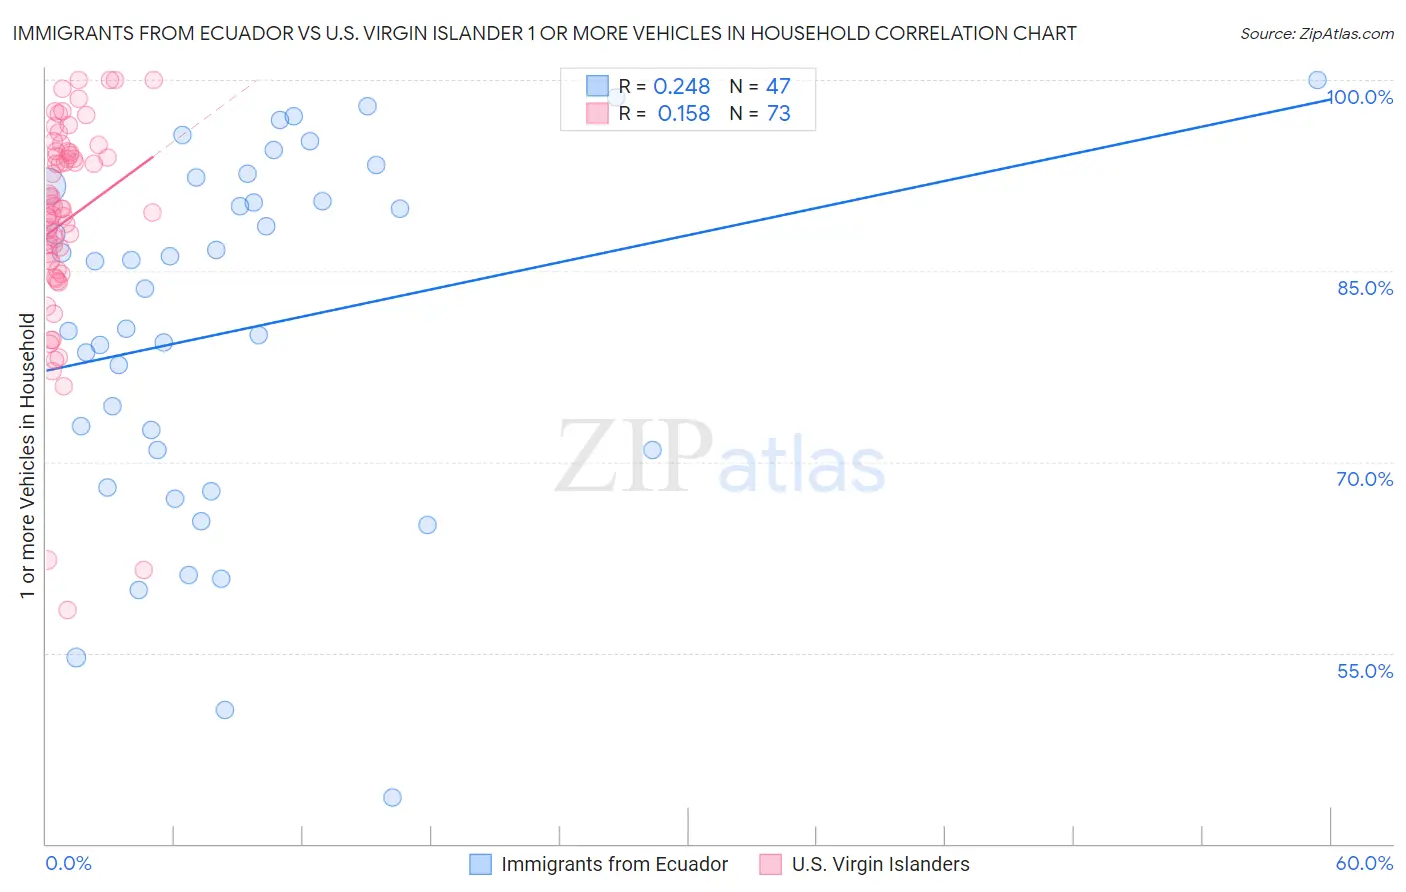
Immigrants from Ecuador vs U.S. Virgin Islander 1 or more Vehicles in Household Correlation Chart
The statistical analysis conducted on geographies consisting of 270,903,190 people shows a weak positive correlation between the proportion of Immigrants from Ecuador and percentage of households with 1 or more vehicles available in the United States with a correlation coefficient (R) of 0.248 and weighted average of 76.2%. Similarly, the statistical analysis conducted on geographies consisting of 87,430,721 people shows a poor positive correlation between the proportion of U.S. Virgin Islanders and percentage of households with 1 or more vehicles available in the United States with a correlation coefficient (R) of 0.158 and weighted average of 84.6%, a difference of 11.0%.
1 or more Vehicles in Household Correlation Summary
| Measurement | Immigrants from Ecuador | U.S. Virgin Islander |
| Minimum | 43.6% | 58.3% |
| Maximum | 100.0% | 100.0% |
| Range | 56.4% | 41.7% |
| Mean | 80.4% | 88.9% |
| Median | 83.6% | 89.9% |
| Interquartile 25% (IQ1) | 70.9% | 85.4% |
| Interquartile 75% (IQ3) | 91.7% | 94.3% |
| Interquartile Range (IQR) | 20.7% | 8.9% |
| Standard Deviation (Sample) | 13.9% | 8.4% |
| Standard Deviation (Population) | 13.7% | 8.3% |
Similar Demographics by 1 or more Vehicles in Household
Demographics Similar to Immigrants from Ecuador by 1 or more Vehicles in Household
In terms of 1 or more vehicles in household, the demographic groups most similar to Immigrants from Ecuador are Trinidadian and Tobagonian (76.3%, a difference of 0.10%), West Indian (76.4%, a difference of 0.18%), Immigrants from Trinidad and Tobago (76.8%, a difference of 0.73%), Immigrants from Dominica (77.8%, a difference of 2.1%), and Ecuadorian (77.9%, a difference of 2.2%).
| Demographics | Rating | Rank | 1 or more Vehicles in Household |
| Immigrants | West Indies | 0.0 /100 | #326 | Tragic 79.5% |
| Immigrants | Senegal | 0.0 /100 | #327 | Tragic 79.0% |
| Ecuadorians | 0.0 /100 | #328 | Tragic 77.9% |
| Immigrants | Dominica | 0.0 /100 | #329 | Tragic 77.8% |
| Immigrants | Trinidad and Tobago | 0.0 /100 | #330 | Tragic 76.8% |
| West Indians | 0.0 /100 | #331 | Tragic 76.4% |
| Trinidadians and Tobagonians | 0.0 /100 | #332 | Tragic 76.3% |
| Immigrants | Ecuador | 0.0 /100 | #333 | Tragic 76.2% |
| Immigrants | Bangladesh | 0.0 /100 | #334 | Tragic 74.3% |
| Barbadians | 0.0 /100 | #335 | Tragic 74.0% |
| Vietnamese | 0.0 /100 | #336 | Tragic 73.8% |
| Immigrants | Uzbekistan | 0.0 /100 | #337 | Tragic 73.4% |
| Inupiat | 0.0 /100 | #338 | Tragic 71.5% |
| Guyanese | 0.0 /100 | #339 | Tragic 70.8% |
| Dominicans | 0.0 /100 | #340 | Tragic 70.7% |
Demographics Similar to U.S. Virgin Islanders by 1 or more Vehicles in Household
In terms of 1 or more vehicles in household, the demographic groups most similar to U.S. Virgin Islanders are Immigrants from Haiti (84.7%, a difference of 0.030%), Immigrants from Belize (84.7%, a difference of 0.040%), Puerto Rican (84.6%, a difference of 0.040%), Tohono O'odham (84.7%, a difference of 0.070%), and Cape Verdean (84.5%, a difference of 0.15%).
| Demographics | Rating | Rank | 1 or more Vehicles in Household |
| Immigrants | Greece | 0.0 /100 | #303 | Tragic 85.4% |
| Immigrants | Ukraine | 0.0 /100 | #304 | Tragic 85.2% |
| Immigrants | China | 0.0 /100 | #305 | Tragic 84.9% |
| Immigrants | Western Africa | 0.0 /100 | #306 | Tragic 84.9% |
| Tohono O'odham | 0.0 /100 | #307 | Tragic 84.7% |
| Immigrants | Belize | 0.0 /100 | #308 | Tragic 84.7% |
| Immigrants | Haiti | 0.0 /100 | #309 | Tragic 84.7% |
| U.S. Virgin Islanders | 0.0 /100 | #310 | Tragic 84.6% |
| Puerto Ricans | 0.0 /100 | #311 | Tragic 84.6% |
| Cape Verdeans | 0.0 /100 | #312 | Tragic 84.5% |
| Immigrants | Israel | 0.0 /100 | #313 | Tragic 84.5% |
| Albanians | 0.0 /100 | #314 | Tragic 84.4% |
| Cypriots | 0.0 /100 | #315 | Tragic 84.4% |
| Alaska Natives | 0.0 /100 | #316 | Tragic 83.8% |
| Ghanaians | 0.0 /100 | #317 | Tragic 83.6% |