Greek vs Immigrants from Argentina 4 or more Vehicles in Household
COMPARE
Greek
Immigrants from Argentina
4 or more Vehicles in Household
4 or more Vehicles in Household Comparison
Greeks
Immigrants from Argentina
6.5%
4 OR MORE VEHICLES IN HOUSEHOLD
73.6/ 100
METRIC RATING
149th/ 347
METRIC RANK
5.9%
4 OR MORE VEHICLES IN HOUSEHOLD
6.0/ 100
METRIC RATING
232nd/ 347
METRIC RANK
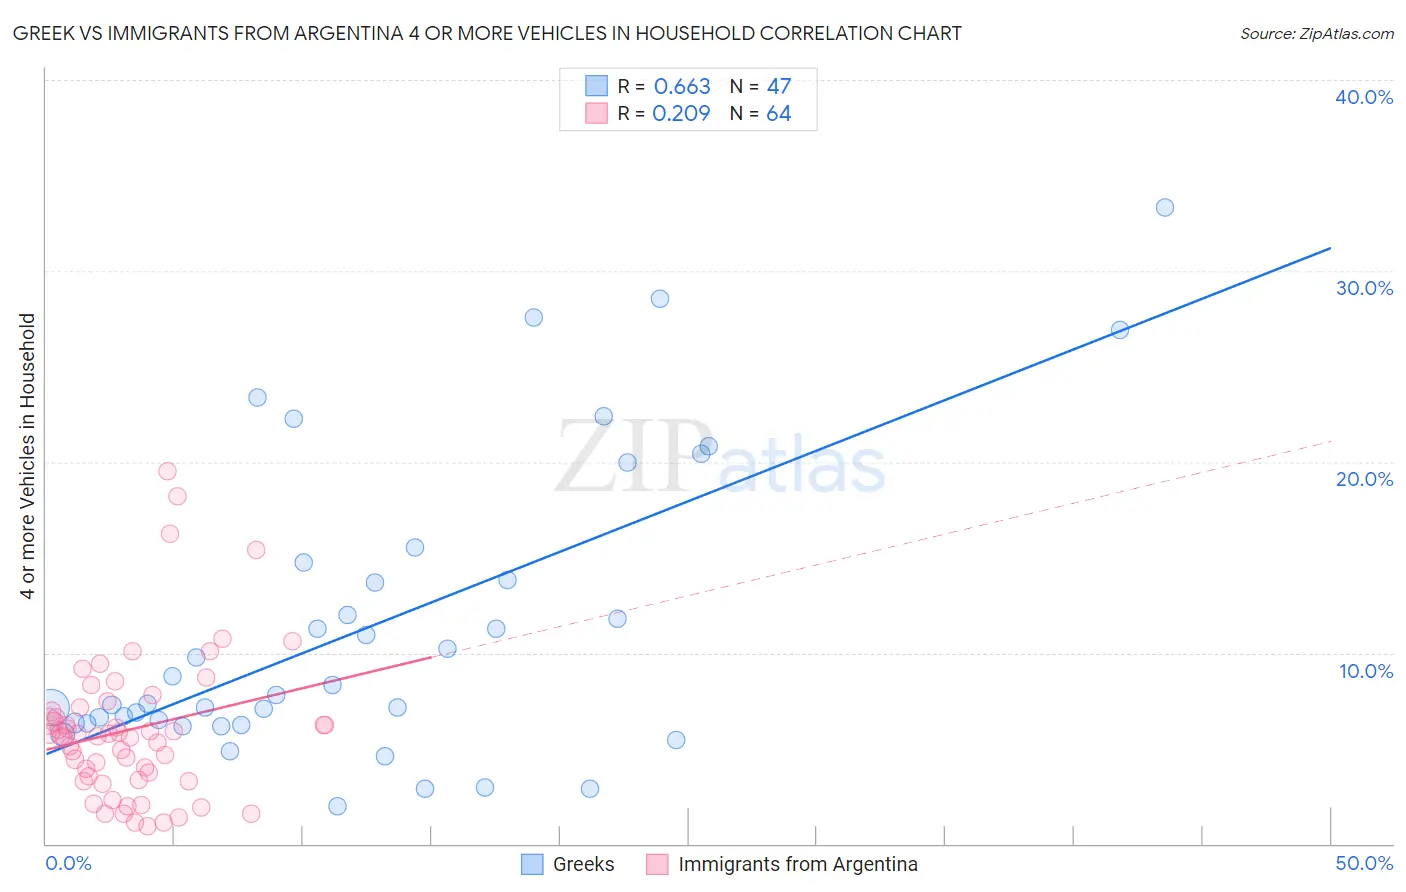
Greek vs Immigrants from Argentina 4 or more Vehicles in Household Correlation Chart
The statistical analysis conducted on geographies consisting of 480,370,844 people shows a significant positive correlation between the proportion of Greeks and percentage of households with 4 or more vehicles available in the United States with a correlation coefficient (R) of 0.663 and weighted average of 6.5%. Similarly, the statistical analysis conducted on geographies consisting of 263,256,749 people shows a weak positive correlation between the proportion of Immigrants from Argentina and percentage of households with 4 or more vehicles available in the United States with a correlation coefficient (R) of 0.209 and weighted average of 5.9%, a difference of 10.3%.
4 or more Vehicles in Household Correlation Summary
| Measurement | Greek | Immigrants from Argentina |
| Minimum | 2.0% | 0.94% |
| Maximum | 33.3% | 19.5% |
| Range | 31.4% | 18.6% |
| Mean | 11.4% | 6.0% |
| Median | 7.8% | 5.7% |
| Interquartile 25% (IQ1) | 6.3% | 3.4% |
| Interquartile 75% (IQ3) | 14.7% | 7.1% |
| Interquartile Range (IQR) | 8.4% | 3.6% |
| Standard Deviation (Sample) | 7.8% | 3.9% |
| Standard Deviation (Population) | 7.7% | 3.8% |
Similar Demographics by 4 or more Vehicles in Household
Demographics Similar to Greeks by 4 or more Vehicles in Household
In terms of 4 or more vehicles in household, the demographic groups most similar to Greeks are Immigrants from Jordan (6.5%, a difference of 0.0%), Immigrants from Iran (6.5%, a difference of 0.040%), New Zealander (6.5%, a difference of 0.040%), Immigrants from Costa Rica (6.5%, a difference of 0.090%), and Immigrants from Hong Kong (6.5%, a difference of 0.18%).
| Demographics | Rating | Rank | 4 or more Vehicles in Household |
| Immigrants | Iraq | 79.4 /100 | #142 | Good 6.5% |
| Immigrants | Canada | 78.6 /100 | #143 | Good 6.5% |
| Immigrants | North America | 78.5 /100 | #144 | Good 6.5% |
| Croatians | 77.8 /100 | #145 | Good 6.5% |
| Immigrants | Costa Rica | 74.4 /100 | #146 | Good 6.5% |
| Immigrants | Iran | 73.9 /100 | #147 | Good 6.5% |
| Immigrants | Jordan | 73.7 /100 | #148 | Good 6.5% |
| Greeks | 73.6 /100 | #149 | Good 6.5% |
| New Zealanders | 73.3 /100 | #150 | Good 6.5% |
| Immigrants | Hong Kong | 72.2 /100 | #151 | Good 6.5% |
| Yuman | 72.1 /100 | #152 | Good 6.5% |
| Immigrants | Armenia | 71.2 /100 | #153 | Good 6.5% |
| Central American Indians | 71.1 /100 | #154 | Good 6.5% |
| Iroquois | 70.4 /100 | #155 | Good 6.5% |
| Iranians | 69.9 /100 | #156 | Good 6.5% |
Demographics Similar to Immigrants from Argentina by 4 or more Vehicles in Household
In terms of 4 or more vehicles in household, the demographic groups most similar to Immigrants from Argentina are Sierra Leonean (5.9%, a difference of 0.010%), Immigrants from Switzerland (5.9%, a difference of 0.18%), Immigrants from Malaysia (5.9%, a difference of 0.30%), Eastern European (5.9%, a difference of 0.37%), and Immigrants from Uganda (5.9%, a difference of 0.65%).
| Demographics | Rating | Rank | 4 or more Vehicles in Household |
| Indonesians | 8.9 /100 | #225 | Tragic 6.0% |
| Immigrants | Singapore | 7.9 /100 | #226 | Tragic 5.9% |
| Immigrants | Western Asia | 7.8 /100 | #227 | Tragic 5.9% |
| Immigrants | Uganda | 7.5 /100 | #228 | Tragic 5.9% |
| Eastern Europeans | 6.8 /100 | #229 | Tragic 5.9% |
| Immigrants | Malaysia | 6.7 /100 | #230 | Tragic 5.9% |
| Immigrants | Switzerland | 6.4 /100 | #231 | Tragic 5.9% |
| Immigrants | Argentina | 6.0 /100 | #232 | Tragic 5.9% |
| Sierra Leoneans | 6.0 /100 | #233 | Tragic 5.9% |
| Africans | 4.6 /100 | #234 | Tragic 5.8% |
| Immigrants | Hungary | 4.6 /100 | #235 | Tragic 5.8% |
| Immigrants | Eritrea | 4.5 /100 | #236 | Tragic 5.8% |
| Turks | 4.1 /100 | #237 | Tragic 5.8% |
| Immigrants | Belgium | 4.0 /100 | #238 | Tragic 5.8% |
| Immigrants | Australia | 3.8 /100 | #239 | Tragic 5.8% |