Immigrants from Eastern Asia vs Immigrants from Australia 1 or more Vehicles in Household
COMPARE
Immigrants from Eastern Asia
Immigrants from Australia
1 or more Vehicles in Household
1 or more Vehicles in Household Comparison
Immigrants from Eastern Asia
Immigrants from Australia
86.5%
1 OR MORE VEHICLES IN HOUSEHOLD
0.0/ 100
METRIC RATING
286th/ 347
METRIC RANK
86.4%
1 OR MORE VEHICLES IN HOUSEHOLD
0.0/ 100
METRIC RATING
290th/ 347
METRIC RANK
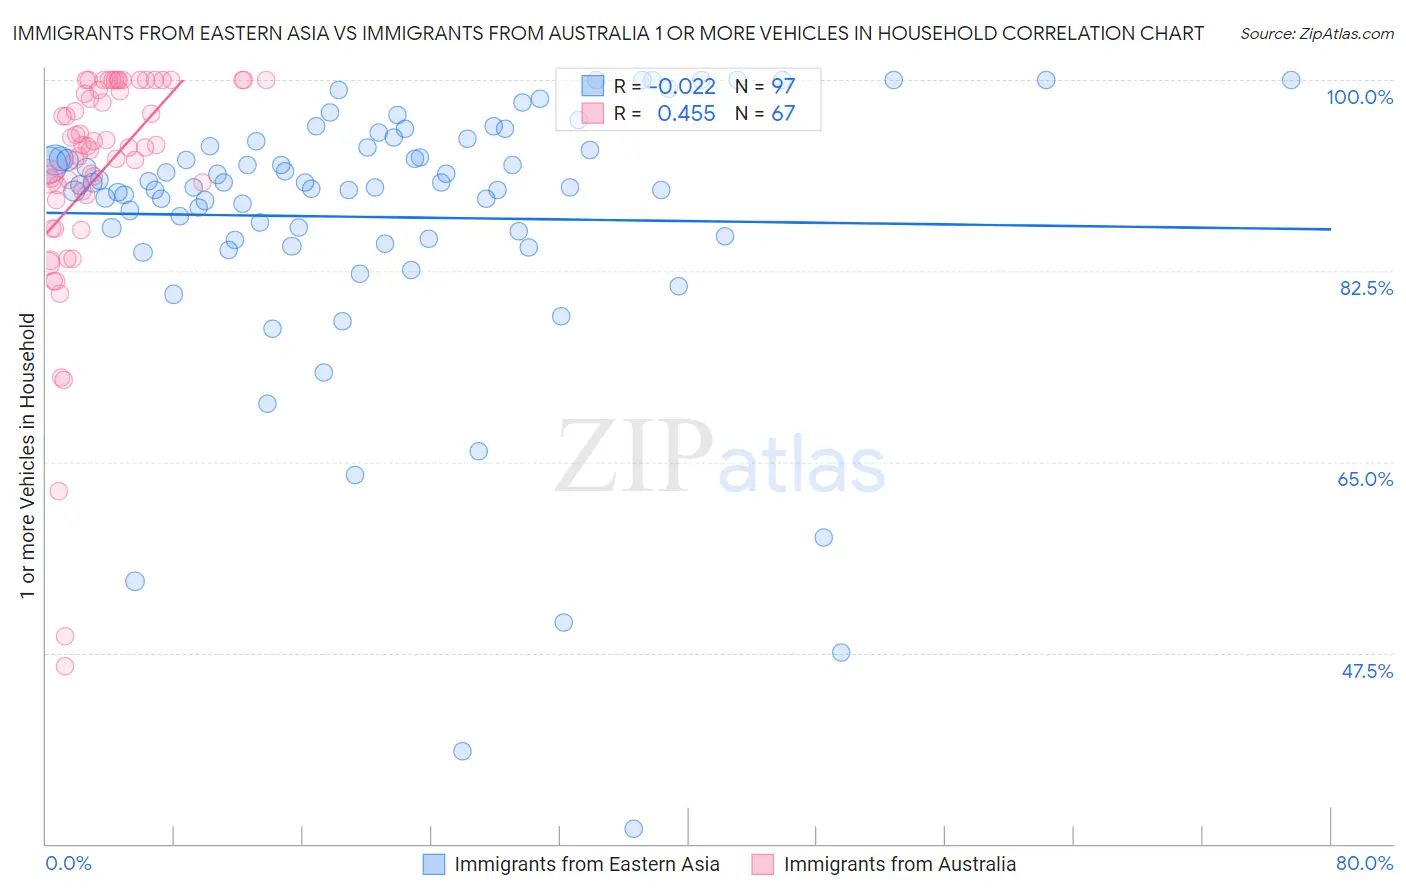
Immigrants from Eastern Asia vs Immigrants from Australia 1 or more Vehicles in Household Correlation Chart
The statistical analysis conducted on geographies consisting of 499,412,711 people shows no correlation between the proportion of Immigrants from Eastern Asia and percentage of households with 1 or more vehicles available in the United States with a correlation coefficient (R) of -0.022 and weighted average of 86.5%. Similarly, the statistical analysis conducted on geographies consisting of 227,104,870 people shows a moderate positive correlation between the proportion of Immigrants from Australia and percentage of households with 1 or more vehicles available in the United States with a correlation coefficient (R) of 0.455 and weighted average of 86.4%, a difference of 0.21%.
1 or more Vehicles in Household Correlation Summary
| Measurement | Immigrants from Eastern Asia | Immigrants from Australia |
| Minimum | 31.4% | 46.3% |
| Maximum | 100.0% | 100.0% |
| Range | 68.6% | 53.7% |
| Mean | 87.4% | 91.4% |
| Median | 90.3% | 94.0% |
| Interquartile 25% (IQ1) | 85.6% | 89.4% |
| Interquartile 75% (IQ3) | 94.1% | 100.0% |
| Interquartile Range (IQR) | 8.6% | 10.6% |
| Standard Deviation (Sample) | 12.8% | 10.9% |
| Standard Deviation (Population) | 12.7% | 10.8% |
Demographics Similar to Immigrants from Eastern Asia and Immigrants from Australia by 1 or more Vehicles in Household
In terms of 1 or more vehicles in household, the demographic groups most similar to Immigrants from Eastern Asia are Immigrants from Kazakhstan (86.6%, a difference of 0.030%), Immigrants from Malaysia (86.5%, a difference of 0.080%), Hopi (86.4%, a difference of 0.15%), Immigrants from Ireland (86.4%, a difference of 0.16%), and Central American Indian (86.7%, a difference of 0.23%). Similarly, the demographic groups most similar to Immigrants from Australia are Immigrants from Ireland (86.4%, a difference of 0.040%), Hopi (86.4%, a difference of 0.060%), Pima (86.3%, a difference of 0.080%), Immigrants from Malaysia (86.5%, a difference of 0.13%), and Immigrants from Kazakhstan (86.6%, a difference of 0.24%).
| Demographics | Rating | Rank | 1 or more Vehicles in Household |
| Immigrants | Southern Europe | 0.1 /100 | #278 | Tragic 87.1% |
| Immigrants | Albania | 0.1 /100 | #279 | Tragic 87.1% |
| Immigrants | Croatia | 0.0 /100 | #280 | Tragic 87.0% |
| Mongolians | 0.0 /100 | #281 | Tragic 87.0% |
| Colville | 0.0 /100 | #282 | Tragic 86.8% |
| Immigrants | Eastern Europe | 0.0 /100 | #283 | Tragic 86.7% |
| Central American Indians | 0.0 /100 | #284 | Tragic 86.7% |
| Immigrants | Kazakhstan | 0.0 /100 | #285 | Tragic 86.6% |
| Immigrants | Eastern Asia | 0.0 /100 | #286 | Tragic 86.5% |
| Immigrants | Malaysia | 0.0 /100 | #287 | Tragic 86.5% |
| Hopi | 0.0 /100 | #288 | Tragic 86.4% |
| Immigrants | Ireland | 0.0 /100 | #289 | Tragic 86.4% |
| Immigrants | Australia | 0.0 /100 | #290 | Tragic 86.4% |
| Pima | 0.0 /100 | #291 | Tragic 86.3% |
| Okinawans | 0.0 /100 | #292 | Tragic 86.1% |
| Indians (Asian) | 0.0 /100 | #293 | Tragic 86.0% |
| Alaskan Athabascans | 0.0 /100 | #294 | Tragic 86.0% |
| Immigrants | Jamaica | 0.0 /100 | #295 | Tragic 85.8% |
| Immigrants | Spain | 0.0 /100 | #296 | Tragic 85.8% |
| Paraguayans | 0.0 /100 | #297 | Tragic 85.7% |
| Belizeans | 0.0 /100 | #298 | Tragic 85.7% |