Immigrants from Eastern Asia vs Comanche 1 or more Vehicles in Household
COMPARE
Immigrants from Eastern Asia
Comanche
1 or more Vehicles in Household
1 or more Vehicles in Household Comparison
Immigrants from Eastern Asia
Comanche
86.5%
1 OR MORE VEHICLES IN HOUSEHOLD
0.0/ 100
METRIC RATING
286th/ 347
METRIC RANK
89.9%
1 OR MORE VEHICLES IN HOUSEHOLD
63.4/ 100
METRIC RATING
164th/ 347
METRIC RANK
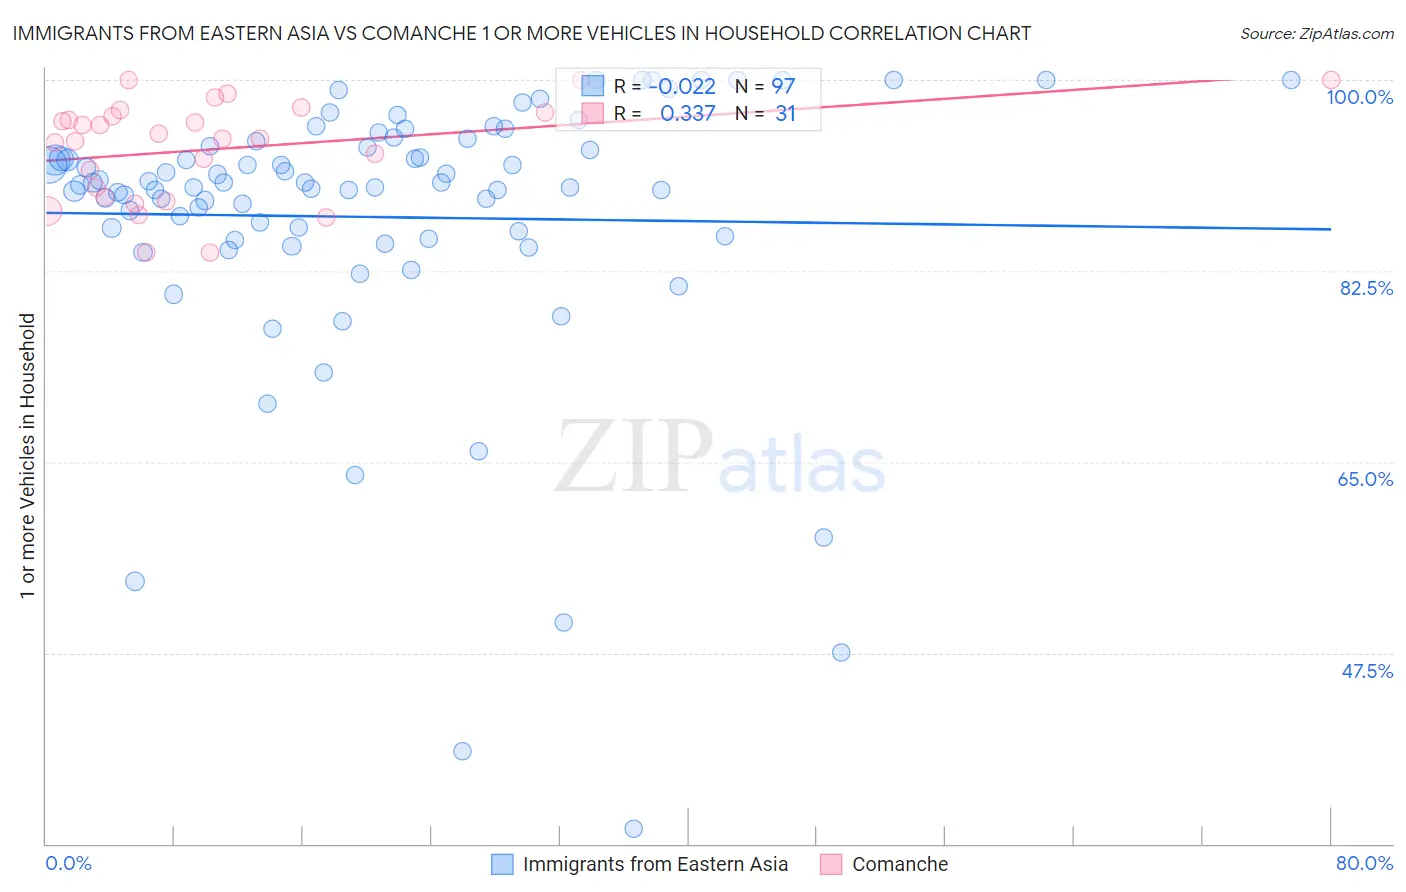
Immigrants from Eastern Asia vs Comanche 1 or more Vehicles in Household Correlation Chart
The statistical analysis conducted on geographies consisting of 499,412,711 people shows no correlation between the proportion of Immigrants from Eastern Asia and percentage of households with 1 or more vehicles available in the United States with a correlation coefficient (R) of -0.022 and weighted average of 86.5%. Similarly, the statistical analysis conducted on geographies consisting of 109,768,112 people shows a mild positive correlation between the proportion of Comanche and percentage of households with 1 or more vehicles available in the United States with a correlation coefficient (R) of 0.337 and weighted average of 89.9%, a difference of 3.9%.
1 or more Vehicles in Household Correlation Summary
| Measurement | Immigrants from Eastern Asia | Comanche |
| Minimum | 31.4% | 84.2% |
| Maximum | 100.0% | 100.0% |
| Range | 68.6% | 15.8% |
| Mean | 87.4% | 93.7% |
| Median | 90.3% | 94.7% |
| Interquartile 25% (IQ1) | 85.6% | 89.2% |
| Interquartile 75% (IQ3) | 94.1% | 97.1% |
| Interquartile Range (IQR) | 8.6% | 7.9% |
| Standard Deviation (Sample) | 12.8% | 4.6% |
| Standard Deviation (Population) | 12.7% | 4.5% |
Similar Demographics by 1 or more Vehicles in Household
Demographics Similar to Immigrants from Eastern Asia by 1 or more Vehicles in Household
In terms of 1 or more vehicles in household, the demographic groups most similar to Immigrants from Eastern Asia are Immigrants from Kazakhstan (86.6%, a difference of 0.030%), Immigrants from Malaysia (86.5%, a difference of 0.080%), Hopi (86.4%, a difference of 0.15%), Immigrants from Ireland (86.4%, a difference of 0.16%), and Immigrants from Australia (86.4%, a difference of 0.21%).
| Demographics | Rating | Rank | 1 or more Vehicles in Household |
| Immigrants | Albania | 0.1 /100 | #279 | Tragic 87.1% |
| Immigrants | Croatia | 0.0 /100 | #280 | Tragic 87.0% |
| Mongolians | 0.0 /100 | #281 | Tragic 87.0% |
| Colville | 0.0 /100 | #282 | Tragic 86.8% |
| Immigrants | Eastern Europe | 0.0 /100 | #283 | Tragic 86.7% |
| Central American Indians | 0.0 /100 | #284 | Tragic 86.7% |
| Immigrants | Kazakhstan | 0.0 /100 | #285 | Tragic 86.6% |
| Immigrants | Eastern Asia | 0.0 /100 | #286 | Tragic 86.5% |
| Immigrants | Malaysia | 0.0 /100 | #287 | Tragic 86.5% |
| Hopi | 0.0 /100 | #288 | Tragic 86.4% |
| Immigrants | Ireland | 0.0 /100 | #289 | Tragic 86.4% |
| Immigrants | Australia | 0.0 /100 | #290 | Tragic 86.4% |
| Pima | 0.0 /100 | #291 | Tragic 86.3% |
| Okinawans | 0.0 /100 | #292 | Tragic 86.1% |
| Indians (Asian) | 0.0 /100 | #293 | Tragic 86.0% |
Demographics Similar to Comanche by 1 or more Vehicles in Household
In terms of 1 or more vehicles in household, the demographic groups most similar to Comanche are Immigrants from Saudi Arabia (89.9%, a difference of 0.010%), Immigrants from Middle Africa (89.9%, a difference of 0.020%), Immigrants from Austria (89.9%, a difference of 0.040%), Immigrants from Latin America (89.8%, a difference of 0.050%), and Immigrants from Cambodia (89.8%, a difference of 0.050%).
| Demographics | Rating | Rank | 1 or more Vehicles in Household |
| Immigrants | Congo | 71.2 /100 | #157 | Good 90.0% |
| Brazilians | 71.0 /100 | #158 | Good 90.0% |
| South Africans | 69.7 /100 | #159 | Good 90.0% |
| Immigrants | Indonesia | 68.8 /100 | #160 | Good 90.0% |
| Salvadorans | 68.7 /100 | #161 | Good 90.0% |
| Spanish American Indians | 67.0 /100 | #162 | Good 89.9% |
| Immigrants | Austria | 65.5 /100 | #163 | Good 89.9% |
| Comanche | 63.4 /100 | #164 | Good 89.9% |
| Immigrants | Saudi Arabia | 62.6 /100 | #165 | Good 89.9% |
| Immigrants | Middle Africa | 62.2 /100 | #166 | Good 89.9% |
| Immigrants | Latin America | 60.3 /100 | #167 | Good 89.8% |
| Immigrants | Cambodia | 60.1 /100 | #168 | Good 89.8% |
| Natives/Alaskans | 59.5 /100 | #169 | Average 89.8% |
| Immigrants | Costa Rica | 57.6 /100 | #170 | Average 89.8% |
| French American Indians | 54.4 /100 | #171 | Average 89.8% |