Afghan vs Immigrants from Australia 1 or more Vehicles in Household
COMPARE
Afghan
Immigrants from Australia
1 or more Vehicles in Household
1 or more Vehicles in Household Comparison
Afghans
Immigrants from Australia
92.1%
1 OR MORE VEHICLES IN HOUSEHOLD
99.9/ 100
METRIC RATING
49th/ 347
METRIC RANK
86.4%
1 OR MORE VEHICLES IN HOUSEHOLD
0.0/ 100
METRIC RATING
290th/ 347
METRIC RANK
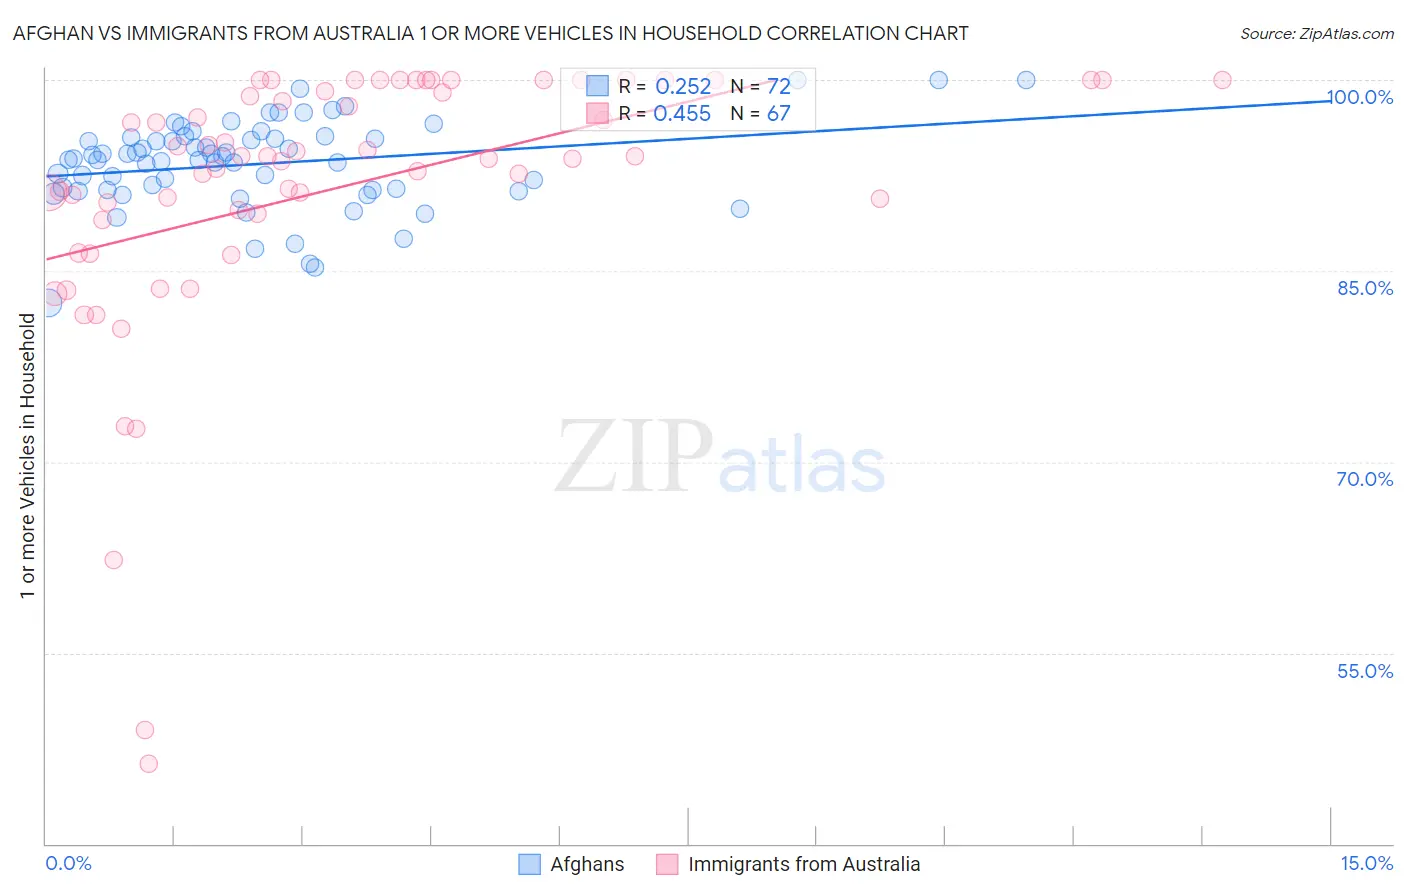
Afghan vs Immigrants from Australia 1 or more Vehicles in Household Correlation Chart
The statistical analysis conducted on geographies consisting of 148,819,650 people shows a weak positive correlation between the proportion of Afghans and percentage of households with 1 or more vehicles available in the United States with a correlation coefficient (R) of 0.252 and weighted average of 92.1%. Similarly, the statistical analysis conducted on geographies consisting of 227,104,870 people shows a moderate positive correlation between the proportion of Immigrants from Australia and percentage of households with 1 or more vehicles available in the United States with a correlation coefficient (R) of 0.455 and weighted average of 86.4%, a difference of 6.7%.
1 or more Vehicles in Household Correlation Summary
| Measurement | Afghan | Immigrants from Australia |
| Minimum | 82.5% | 46.3% |
| Maximum | 100.0% | 100.0% |
| Range | 17.5% | 53.7% |
| Mean | 93.4% | 91.4% |
| Median | 93.8% | 94.0% |
| Interquartile 25% (IQ1) | 91.3% | 89.4% |
| Interquartile 75% (IQ3) | 95.4% | 100.0% |
| Interquartile Range (IQR) | 4.1% | 10.6% |
| Standard Deviation (Sample) | 3.5% | 10.9% |
| Standard Deviation (Population) | 3.4% | 10.8% |
Similar Demographics by 1 or more Vehicles in Household
Demographics Similar to Afghans by 1 or more Vehicles in Household
In terms of 1 or more vehicles in household, the demographic groups most similar to Afghans are Belgian (92.1%, a difference of 0.010%), Guamanian/Chamorro (92.1%, a difference of 0.010%), Celtic (92.1%, a difference of 0.020%), Korean (92.1%, a difference of 0.050%), and Hawaiian (92.0%, a difference of 0.080%).
| Demographics | Rating | Rank | 1 or more Vehicles in Household |
| Chickasaw | 99.9 /100 | #42 | Exceptional 92.3% |
| Spanish | 99.9 /100 | #43 | Exceptional 92.3% |
| Choctaw | 99.9 /100 | #44 | Exceptional 92.2% |
| Immigrants | Nonimmigrants | 99.9 /100 | #45 | Exceptional 92.2% |
| Immigrants | Fiji | 99.9 /100 | #46 | Exceptional 92.2% |
| Northern Europeans | 99.9 /100 | #47 | Exceptional 92.2% |
| Belgians | 99.9 /100 | #48 | Exceptional 92.1% |
| Afghans | 99.9 /100 | #49 | Exceptional 92.1% |
| Guamanians/Chamorros | 99.9 /100 | #50 | Exceptional 92.1% |
| Celtics | 99.9 /100 | #51 | Exceptional 92.1% |
| Koreans | 99.9 /100 | #52 | Exceptional 92.1% |
| Hawaiians | 99.9 /100 | #53 | Exceptional 92.0% |
| Slovenes | 99.9 /100 | #54 | Exceptional 92.0% |
| Immigrants | Afghanistan | 99.9 /100 | #55 | Exceptional 92.0% |
| Immigrants | Venezuela | 99.9 /100 | #56 | Exceptional 92.0% |
Demographics Similar to Immigrants from Australia by 1 or more Vehicles in Household
In terms of 1 or more vehicles in household, the demographic groups most similar to Immigrants from Australia are Immigrants from Ireland (86.4%, a difference of 0.040%), Hopi (86.4%, a difference of 0.060%), Pima (86.3%, a difference of 0.080%), Immigrants from Malaysia (86.5%, a difference of 0.13%), and Immigrants from Eastern Asia (86.5%, a difference of 0.21%).
| Demographics | Rating | Rank | 1 or more Vehicles in Household |
| Immigrants | Eastern Europe | 0.0 /100 | #283 | Tragic 86.7% |
| Central American Indians | 0.0 /100 | #284 | Tragic 86.7% |
| Immigrants | Kazakhstan | 0.0 /100 | #285 | Tragic 86.6% |
| Immigrants | Eastern Asia | 0.0 /100 | #286 | Tragic 86.5% |
| Immigrants | Malaysia | 0.0 /100 | #287 | Tragic 86.5% |
| Hopi | 0.0 /100 | #288 | Tragic 86.4% |
| Immigrants | Ireland | 0.0 /100 | #289 | Tragic 86.4% |
| Immigrants | Australia | 0.0 /100 | #290 | Tragic 86.4% |
| Pima | 0.0 /100 | #291 | Tragic 86.3% |
| Okinawans | 0.0 /100 | #292 | Tragic 86.1% |
| Indians (Asian) | 0.0 /100 | #293 | Tragic 86.0% |
| Alaskan Athabascans | 0.0 /100 | #294 | Tragic 86.0% |
| Immigrants | Jamaica | 0.0 /100 | #295 | Tragic 85.8% |
| Immigrants | Spain | 0.0 /100 | #296 | Tragic 85.8% |
| Paraguayans | 0.0 /100 | #297 | Tragic 85.7% |