Immigrants from Eastern Asia vs Immigrants from Western Asia 1 or more Vehicles in Household
COMPARE
Immigrants from Eastern Asia
Immigrants from Western Asia
1 or more Vehicles in Household
1 or more Vehicles in Household Comparison
Immigrants from Eastern Asia
Immigrants from Western Asia
86.5%
1 OR MORE VEHICLES IN HOUSEHOLD
0.0/ 100
METRIC RATING
286th/ 347
METRIC RANK
89.0%
1 OR MORE VEHICLES IN HOUSEHOLD
12.3/ 100
METRIC RATING
213th/ 347
METRIC RANK
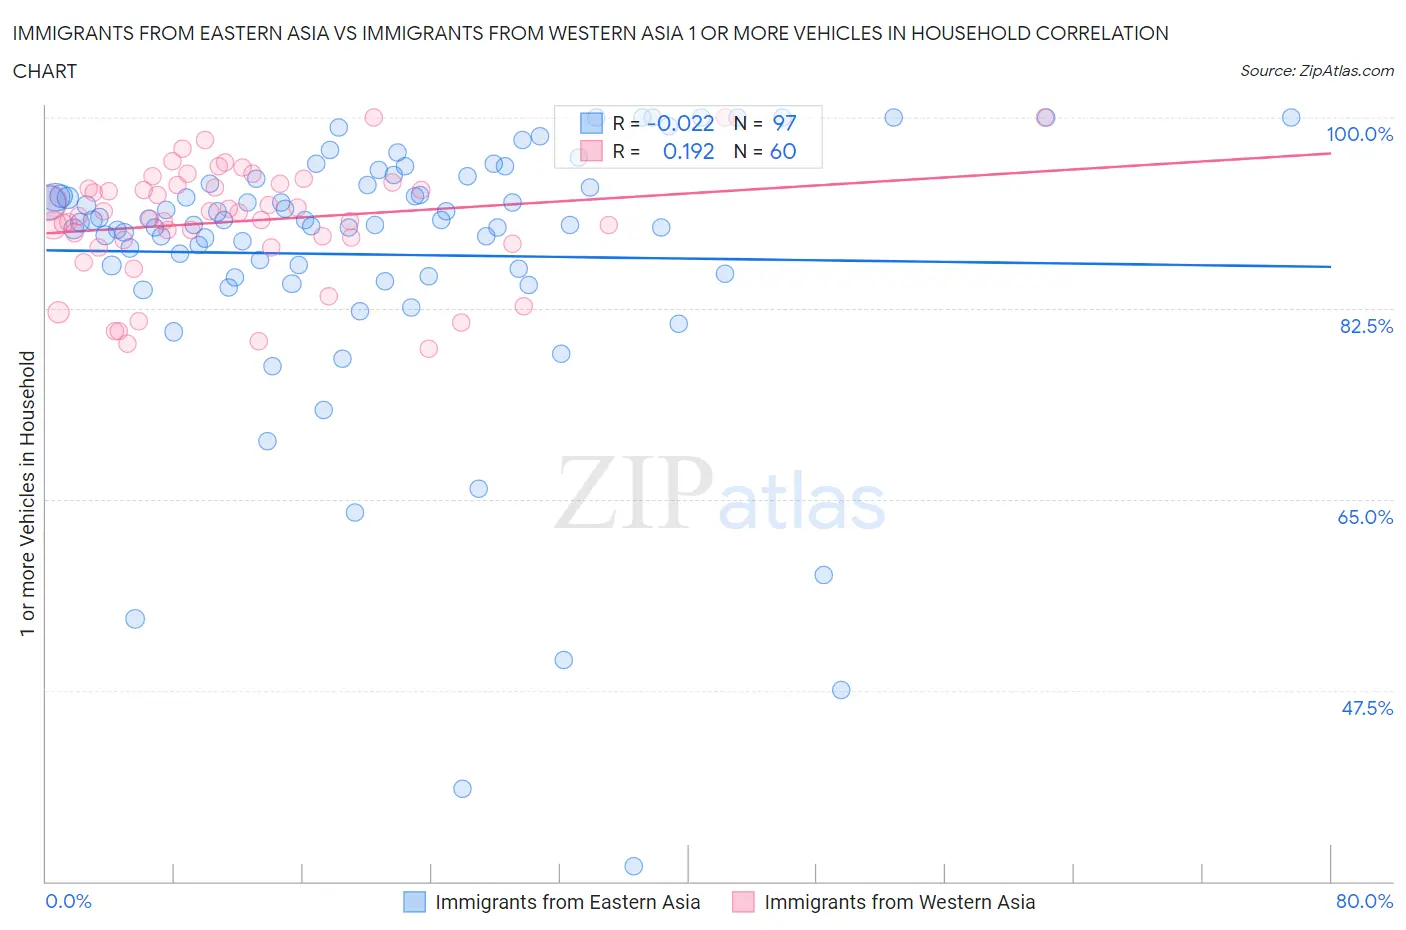
Immigrants from Eastern Asia vs Immigrants from Western Asia 1 or more Vehicles in Household Correlation Chart
The statistical analysis conducted on geographies consisting of 499,412,711 people shows no correlation between the proportion of Immigrants from Eastern Asia and percentage of households with 1 or more vehicles available in the United States with a correlation coefficient (R) of -0.022 and weighted average of 86.5%. Similarly, the statistical analysis conducted on geographies consisting of 404,226,276 people shows a poor positive correlation between the proportion of Immigrants from Western Asia and percentage of households with 1 or more vehicles available in the United States with a correlation coefficient (R) of 0.192 and weighted average of 89.0%, a difference of 2.9%.
1 or more Vehicles in Household Correlation Summary
| Measurement | Immigrants from Eastern Asia | Immigrants from Western Asia |
| Minimum | 31.4% | 78.8% |
| Maximum | 100.0% | 100.0% |
| Range | 68.6% | 21.2% |
| Mean | 87.4% | 90.5% |
| Median | 90.3% | 91.1% |
| Interquartile 25% (IQ1) | 85.6% | 88.6% |
| Interquartile 75% (IQ3) | 94.1% | 93.8% |
| Interquartile Range (IQR) | 8.6% | 5.3% |
| Standard Deviation (Sample) | 12.8% | 5.3% |
| Standard Deviation (Population) | 12.7% | 5.2% |
Similar Demographics by 1 or more Vehicles in Household
Demographics Similar to Immigrants from Eastern Asia by 1 or more Vehicles in Household
In terms of 1 or more vehicles in household, the demographic groups most similar to Immigrants from Eastern Asia are Immigrants from Kazakhstan (86.6%, a difference of 0.030%), Immigrants from Malaysia (86.5%, a difference of 0.080%), Hopi (86.4%, a difference of 0.15%), Immigrants from Ireland (86.4%, a difference of 0.16%), and Immigrants from Australia (86.4%, a difference of 0.21%).
| Demographics | Rating | Rank | 1 or more Vehicles in Household |
| Immigrants | Albania | 0.1 /100 | #279 | Tragic 87.1% |
| Immigrants | Croatia | 0.0 /100 | #280 | Tragic 87.0% |
| Mongolians | 0.0 /100 | #281 | Tragic 87.0% |
| Colville | 0.0 /100 | #282 | Tragic 86.8% |
| Immigrants | Eastern Europe | 0.0 /100 | #283 | Tragic 86.7% |
| Central American Indians | 0.0 /100 | #284 | Tragic 86.7% |
| Immigrants | Kazakhstan | 0.0 /100 | #285 | Tragic 86.6% |
| Immigrants | Eastern Asia | 0.0 /100 | #286 | Tragic 86.5% |
| Immigrants | Malaysia | 0.0 /100 | #287 | Tragic 86.5% |
| Hopi | 0.0 /100 | #288 | Tragic 86.4% |
| Immigrants | Ireland | 0.0 /100 | #289 | Tragic 86.4% |
| Immigrants | Australia | 0.0 /100 | #290 | Tragic 86.4% |
| Pima | 0.0 /100 | #291 | Tragic 86.3% |
| Okinawans | 0.0 /100 | #292 | Tragic 86.1% |
| Indians (Asian) | 0.0 /100 | #293 | Tragic 86.0% |
Demographics Similar to Immigrants from Western Asia by 1 or more Vehicles in Household
In terms of 1 or more vehicles in household, the demographic groups most similar to Immigrants from Western Asia are Immigrants from Hungary (89.0%, a difference of 0.010%), Somali (89.0%, a difference of 0.020%), Sierra Leonean (89.0%, a difference of 0.030%), Dutch West Indian (89.0%, a difference of 0.040%), and Immigrants from Italy (89.1%, a difference of 0.060%).
| Demographics | Rating | Rank | 1 or more Vehicles in Household |
| Apache | 16.2 /100 | #206 | Poor 89.1% |
| Immigrants | Denmark | 14.8 /100 | #207 | Poor 89.1% |
| Immigrants | Chile | 14.4 /100 | #208 | Poor 89.1% |
| Immigrants | Italy | 14.0 /100 | #209 | Poor 89.1% |
| Dutch West Indians | 13.5 /100 | #210 | Poor 89.0% |
| Sierra Leoneans | 13.0 /100 | #211 | Poor 89.0% |
| Somalis | 12.8 /100 | #212 | Poor 89.0% |
| Immigrants | Western Asia | 12.3 /100 | #213 | Poor 89.0% |
| Immigrants | Hungary | 11.9 /100 | #214 | Poor 89.0% |
| Immigrants | Sri Lanka | 10.2 /100 | #215 | Poor 88.9% |
| Immigrants | Argentina | 9.4 /100 | #216 | Tragic 88.9% |
| Argentineans | 8.8 /100 | #217 | Tragic 88.9% |
| Ugandans | 8.7 /100 | #218 | Tragic 88.9% |
| Immigrants | Guatemala | 8.6 /100 | #219 | Tragic 88.9% |
| Immigrants | Zaire | 8.1 /100 | #220 | Tragic 88.8% |