Immigrants from Sweden vs Immigrants from Australia 1 or more Vehicles in Household
COMPARE
Immigrants from Sweden
Immigrants from Australia
1 or more Vehicles in Household
1 or more Vehicles in Household Comparison
Immigrants from Sweden
Immigrants from Australia
89.3%
1 OR MORE VEHICLES IN HOUSEHOLD
23.6/ 100
METRIC RATING
197th/ 347
METRIC RANK
86.4%
1 OR MORE VEHICLES IN HOUSEHOLD
0.0/ 100
METRIC RATING
290th/ 347
METRIC RANK
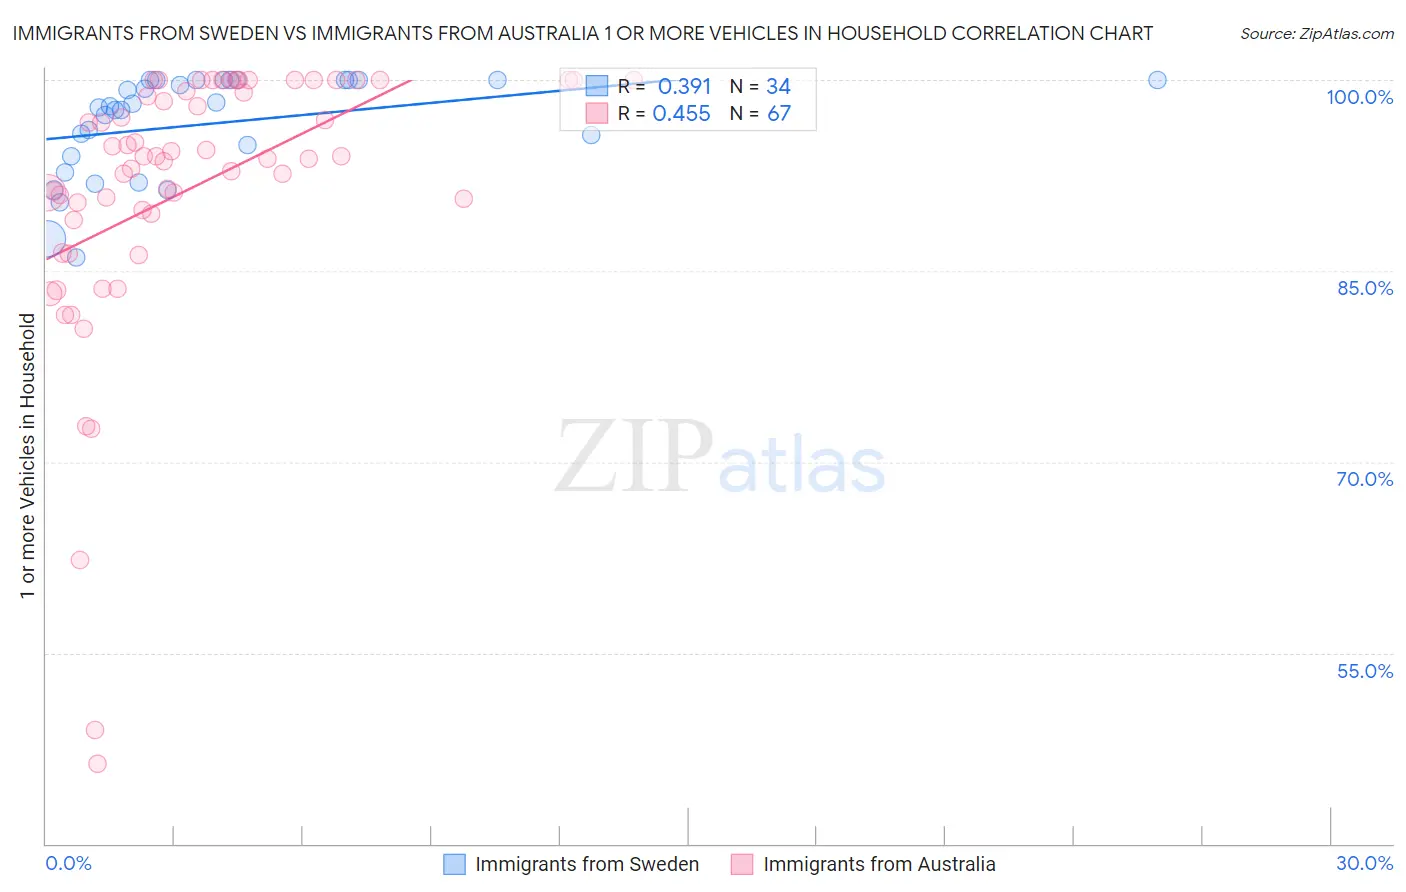
Immigrants from Sweden vs Immigrants from Australia 1 or more Vehicles in Household Correlation Chart
The statistical analysis conducted on geographies consisting of 164,706,538 people shows a mild positive correlation between the proportion of Immigrants from Sweden and percentage of households with 1 or more vehicles available in the United States with a correlation coefficient (R) of 0.391 and weighted average of 89.3%. Similarly, the statistical analysis conducted on geographies consisting of 227,104,870 people shows a moderate positive correlation between the proportion of Immigrants from Australia and percentage of households with 1 or more vehicles available in the United States with a correlation coefficient (R) of 0.455 and weighted average of 86.4%, a difference of 3.4%.
1 or more Vehicles in Household Correlation Summary
| Measurement | Immigrants from Sweden | Immigrants from Australia |
| Minimum | 86.1% | 46.3% |
| Maximum | 100.0% | 100.0% |
| Range | 13.9% | 53.7% |
| Mean | 96.5% | 91.4% |
| Median | 97.9% | 94.0% |
| Interquartile 25% (IQ1) | 94.0% | 89.4% |
| Interquartile 75% (IQ3) | 100.0% | 100.0% |
| Interquartile Range (IQR) | 6.0% | 10.6% |
| Standard Deviation (Sample) | 4.0% | 10.9% |
| Standard Deviation (Population) | 3.9% | 10.8% |
Similar Demographics by 1 or more Vehicles in Household
Demographics Similar to Immigrants from Sweden by 1 or more Vehicles in Household
In terms of 1 or more vehicles in household, the demographic groups most similar to Immigrants from Sweden are Crow (89.3%, a difference of 0.010%), Pennsylvania German (89.3%, a difference of 0.020%), Immigrants from Asia (89.3%, a difference of 0.020%), Central American (89.2%, a difference of 0.050%), and Immigrants from Western Europe (89.2%, a difference of 0.070%).
| Demographics | Rating | Rank | 1 or more Vehicles in Household |
| Shoshone | 37.5 /100 | #190 | Fair 89.5% |
| Immigrants | Poland | 37.1 /100 | #191 | Fair 89.5% |
| Immigrants | North Macedonia | 36.5 /100 | #192 | Fair 89.5% |
| Immigrants | Northern Europe | 35.5 /100 | #193 | Fair 89.5% |
| Immigrants | Eritrea | 33.2 /100 | #194 | Fair 89.4% |
| Immigrants | Armenia | 31.8 /100 | #195 | Fair 89.4% |
| Crow | 24.3 /100 | #196 | Fair 89.3% |
| Immigrants | Sweden | 23.6 /100 | #197 | Fair 89.3% |
| Pennsylvania Germans | 22.9 /100 | #198 | Fair 89.3% |
| Immigrants | Asia | 22.8 /100 | #199 | Fair 89.3% |
| Central Americans | 21.4 /100 | #200 | Fair 89.2% |
| Immigrants | Western Europe | 20.5 /100 | #201 | Fair 89.2% |
| Iroquois | 19.8 /100 | #202 | Poor 89.2% |
| Cambodians | 18.9 /100 | #203 | Poor 89.2% |
| Romanians | 18.2 /100 | #204 | Poor 89.2% |
Demographics Similar to Immigrants from Australia by 1 or more Vehicles in Household
In terms of 1 or more vehicles in household, the demographic groups most similar to Immigrants from Australia are Immigrants from Ireland (86.4%, a difference of 0.040%), Hopi (86.4%, a difference of 0.060%), Pima (86.3%, a difference of 0.080%), Immigrants from Malaysia (86.5%, a difference of 0.13%), and Immigrants from Eastern Asia (86.5%, a difference of 0.21%).
| Demographics | Rating | Rank | 1 or more Vehicles in Household |
| Immigrants | Eastern Europe | 0.0 /100 | #283 | Tragic 86.7% |
| Central American Indians | 0.0 /100 | #284 | Tragic 86.7% |
| Immigrants | Kazakhstan | 0.0 /100 | #285 | Tragic 86.6% |
| Immigrants | Eastern Asia | 0.0 /100 | #286 | Tragic 86.5% |
| Immigrants | Malaysia | 0.0 /100 | #287 | Tragic 86.5% |
| Hopi | 0.0 /100 | #288 | Tragic 86.4% |
| Immigrants | Ireland | 0.0 /100 | #289 | Tragic 86.4% |
| Immigrants | Australia | 0.0 /100 | #290 | Tragic 86.4% |
| Pima | 0.0 /100 | #291 | Tragic 86.3% |
| Okinawans | 0.0 /100 | #292 | Tragic 86.1% |
| Indians (Asian) | 0.0 /100 | #293 | Tragic 86.0% |
| Alaskan Athabascans | 0.0 /100 | #294 | Tragic 86.0% |
| Immigrants | Jamaica | 0.0 /100 | #295 | Tragic 85.8% |
| Immigrants | Spain | 0.0 /100 | #296 | Tragic 85.8% |
| Paraguayans | 0.0 /100 | #297 | Tragic 85.7% |