Immigrants from Eastern Asia vs Czechoslovakian Unemployment Among Ages 25 to 29 years
COMPARE
Immigrants from Eastern Asia
Czechoslovakian
Unemployment Among Ages 25 to 29 years
Unemployment Among Ages 25 to 29 years Comparison
Immigrants from Eastern Asia
Czechoslovakians
6.2%
UNEMPLOYMENT AMONG AGES 25 TO 29 YEARS
98.4/ 100
METRIC RATING
58th/ 347
METRIC RANK
6.7%
UNEMPLOYMENT AMONG AGES 25 TO 29 YEARS
40.7/ 100
METRIC RATING
182nd/ 347
METRIC RANK
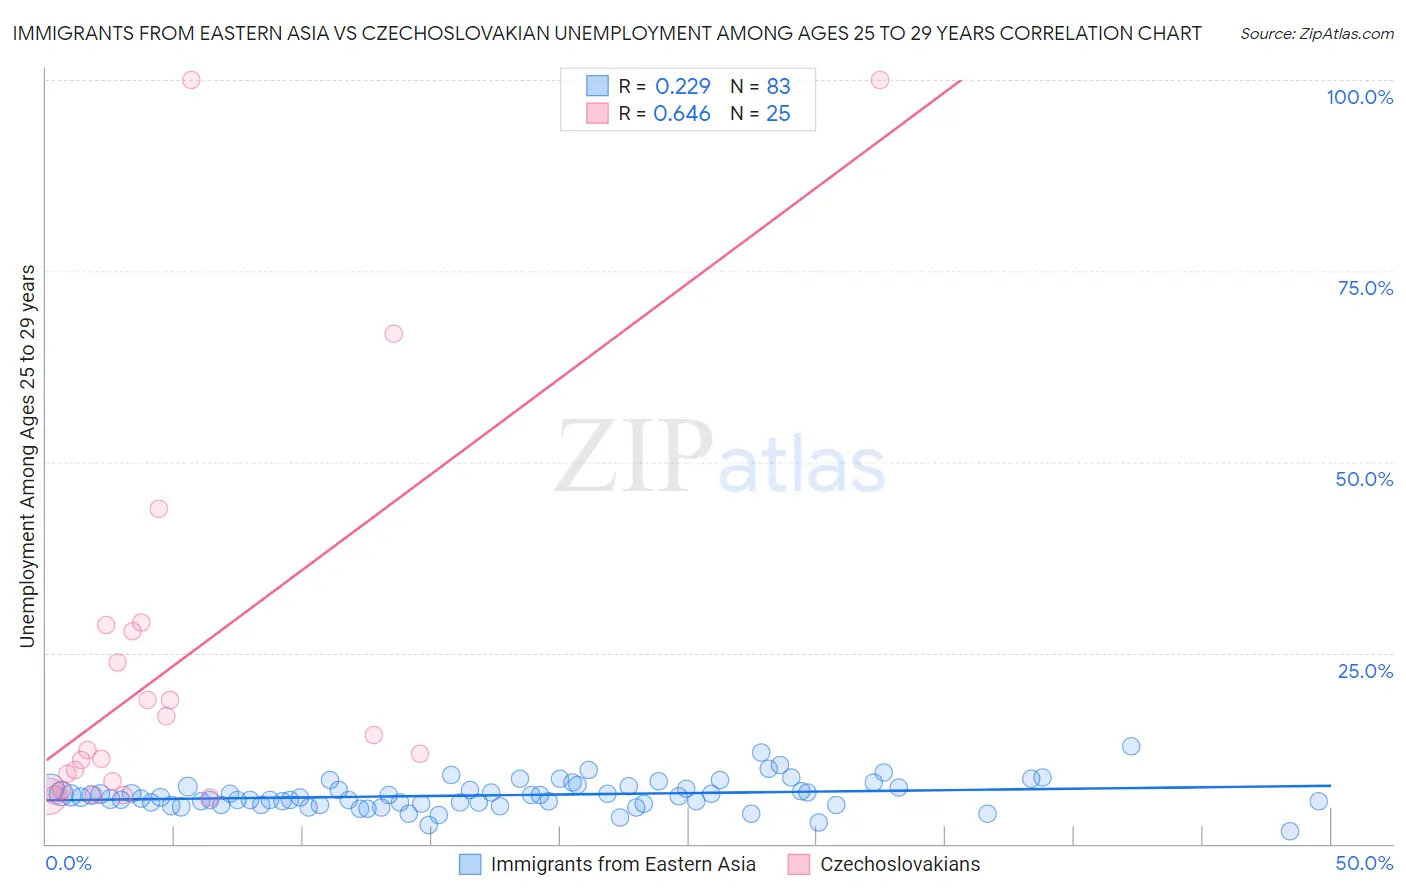
Immigrants from Eastern Asia vs Czechoslovakian Unemployment Among Ages 25 to 29 years Correlation Chart
The statistical analysis conducted on geographies consisting of 463,815,743 people shows a weak positive correlation between the proportion of Immigrants from Eastern Asia and unemployment rate among population between the ages 25 and 29 in the United States with a correlation coefficient (R) of 0.229 and weighted average of 6.2%. Similarly, the statistical analysis conducted on geographies consisting of 346,829,717 people shows a significant positive correlation between the proportion of Czechoslovakians and unemployment rate among population between the ages 25 and 29 in the United States with a correlation coefficient (R) of 0.646 and weighted average of 6.7%, a difference of 7.4%.
Unemployment Among Ages 25 to 29 years Correlation Summary
| Measurement | Immigrants from Eastern Asia | Czechoslovakian |
| Minimum | 1.7% | 6.1% |
| Maximum | 12.7% | 100.0% |
| Range | 11.0% | 93.9% |
| Mean | 6.4% | 24.0% |
| Median | 6.1% | 12.3% |
| Interquartile 25% (IQ1) | 5.2% | 7.6% |
| Interquartile 75% (IQ3) | 7.4% | 28.2% |
| Interquartile Range (IQR) | 2.2% | 20.6% |
| Standard Deviation (Sample) | 1.9% | 26.8% |
| Standard Deviation (Population) | 1.9% | 26.2% |
Similar Demographics by Unemployment Among Ages 25 to 29 years
Demographics Similar to Immigrants from Eastern Asia by Unemployment Among Ages 25 to 29 years
In terms of unemployment among ages 25 to 29 years, the demographic groups most similar to Immigrants from Eastern Asia are Luxembourger (6.2%, a difference of 0.13%), Immigrants from Taiwan (6.2%, a difference of 0.15%), Immigrants from Saudi Arabia (6.2%, a difference of 0.16%), Immigrants from Burma/Myanmar (6.2%, a difference of 0.25%), and Immigrants from Netherlands (6.2%, a difference of 0.27%).
| Demographics | Rating | Rank | Unemployment Among Ages 25 to 29 years |
| Burmese | 98.9 /100 | #51 | Exceptional 6.2% |
| Immigrants | Turkey | 98.9 /100 | #52 | Exceptional 6.2% |
| Turks | 98.8 /100 | #53 | Exceptional 6.2% |
| Swedes | 98.8 /100 | #54 | Exceptional 6.2% |
| Immigrants | Netherlands | 98.7 /100 | #55 | Exceptional 6.2% |
| Immigrants | Burma/Myanmar | 98.7 /100 | #56 | Exceptional 6.2% |
| Immigrants | Saudi Arabia | 98.6 /100 | #57 | Exceptional 6.2% |
| Immigrants | Eastern Asia | 98.4 /100 | #58 | Exceptional 6.2% |
| Luxembourgers | 98.3 /100 | #59 | Exceptional 6.2% |
| Immigrants | Taiwan | 98.3 /100 | #60 | Exceptional 6.2% |
| Bhutanese | 98.2 /100 | #61 | Exceptional 6.2% |
| Immigrants | China | 98.1 /100 | #62 | Exceptional 6.2% |
| Kenyans | 98.0 /100 | #63 | Exceptional 6.3% |
| Immigrants | Sri Lanka | 97.9 /100 | #64 | Exceptional 6.3% |
| Immigrants | Lebanon | 97.8 /100 | #65 | Exceptional 6.3% |
Demographics Similar to Czechoslovakians by Unemployment Among Ages 25 to 29 years
In terms of unemployment among ages 25 to 29 years, the demographic groups most similar to Czechoslovakians are Immigrants from Africa (6.7%, a difference of 0.020%), Immigrants from Western Europe (6.7%, a difference of 0.020%), Immigrants from Scotland (6.7%, a difference of 0.070%), Immigrants from Costa Rica (6.7%, a difference of 0.15%), and Costa Rican (6.7%, a difference of 0.27%).
| Demographics | Rating | Rank | Unemployment Among Ages 25 to 29 years |
| Immigrants | South Eastern Asia | 49.1 /100 | #175 | Average 6.7% |
| Osage | 48.1 /100 | #176 | Average 6.7% |
| Immigrants | Israel | 47.8 /100 | #177 | Average 6.7% |
| Immigrants | Iraq | 45.1 /100 | #178 | Average 6.7% |
| Costa Ricans | 44.9 /100 | #179 | Average 6.7% |
| Immigrants | Africa | 41.1 /100 | #180 | Average 6.7% |
| Immigrants | Western Europe | 41.1 /100 | #181 | Average 6.7% |
| Czechoslovakians | 40.7 /100 | #182 | Average 6.7% |
| Immigrants | Scotland | 39.6 /100 | #183 | Fair 6.7% |
| Immigrants | Costa Rica | 38.3 /100 | #184 | Fair 6.7% |
| Moroccans | 35.9 /100 | #185 | Fair 6.7% |
| Immigrants | Iran | 34.4 /100 | #186 | Fair 6.7% |
| Immigrants | South America | 33.0 /100 | #187 | Fair 6.7% |
| Irish | 32.8 /100 | #188 | Fair 6.7% |
| Argentineans | 32.1 /100 | #189 | Fair 6.7% |