Immigrants from Denmark vs Immigrants from Pakistan 3 or more Vehicles in Household
COMPARE
Immigrants from Denmark
Immigrants from Pakistan
3 or more Vehicles in Household
3 or more Vehicles in Household Comparison
Immigrants from Denmark
Immigrants from Pakistan
19.6%
3 OR MORE VEHICLES IN HOUSEHOLD
57.6/ 100
METRIC RATING
169th/ 347
METRIC RANK
19.8%
3 OR MORE VEHICLES IN HOUSEHOLD
68.2/ 100
METRIC RATING
159th/ 347
METRIC RANK
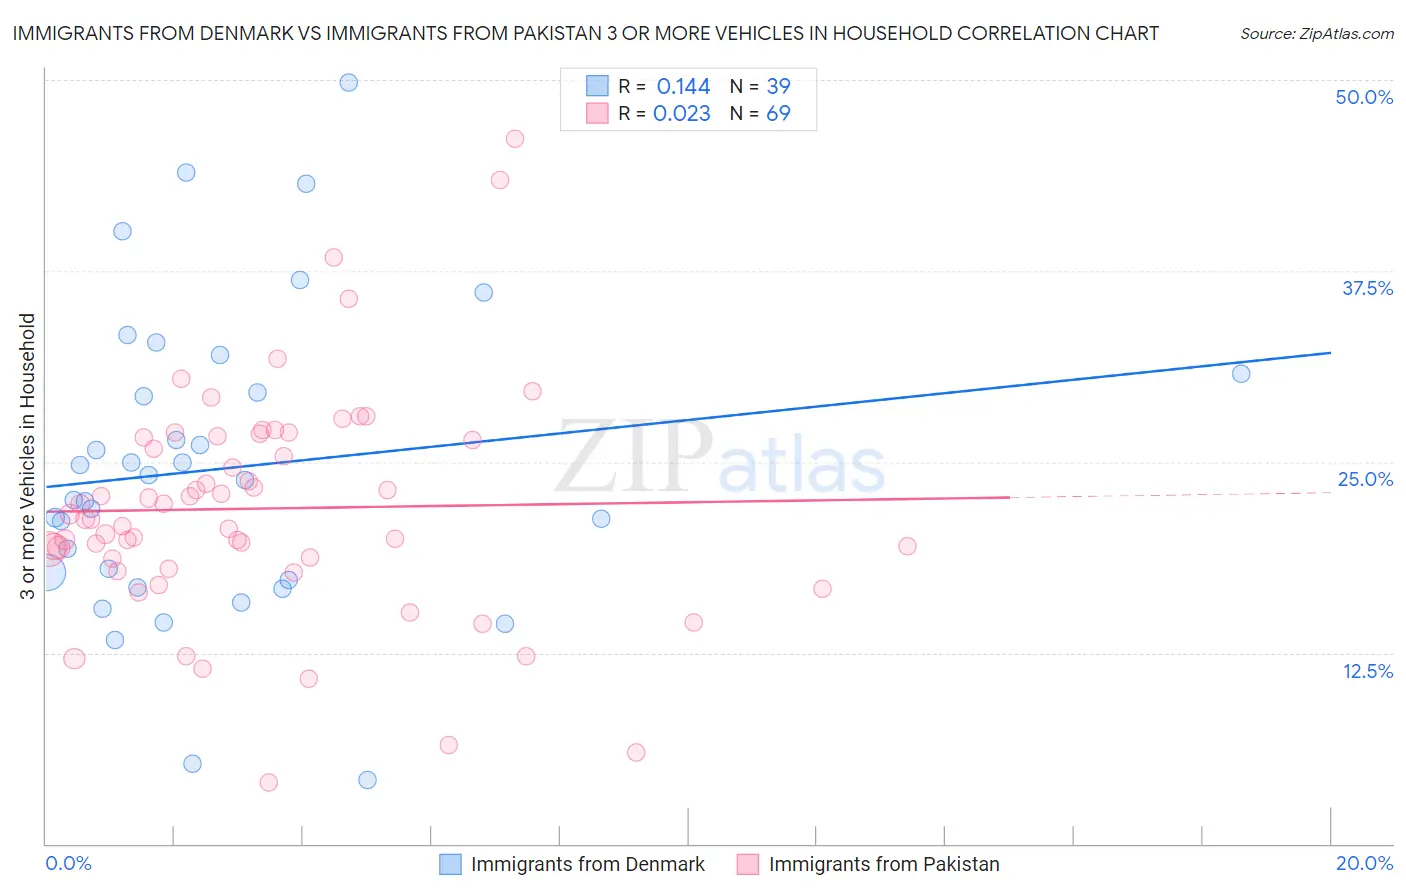
Immigrants from Denmark vs Immigrants from Pakistan 3 or more Vehicles in Household Correlation Chart
The statistical analysis conducted on geographies consisting of 136,395,357 people shows a poor positive correlation between the proportion of Immigrants from Denmark and percentage of households with 3 or more vehicles available in the United States with a correlation coefficient (R) of 0.144 and weighted average of 19.6%. Similarly, the statistical analysis conducted on geographies consisting of 283,714,957 people shows no correlation between the proportion of Immigrants from Pakistan and percentage of households with 3 or more vehicles available in the United States with a correlation coefficient (R) of 0.023 and weighted average of 19.8%, a difference of 0.85%.
3 or more Vehicles in Household Correlation Summary
| Measurement | Immigrants from Denmark | Immigrants from Pakistan |
| Minimum | 4.2% | 4.0% |
| Maximum | 49.9% | 46.2% |
| Range | 45.7% | 42.1% |
| Mean | 24.6% | 21.9% |
| Median | 23.8% | 21.3% |
| Interquartile 25% (IQ1) | 17.2% | 18.3% |
| Interquartile 75% (IQ3) | 30.8% | 26.6% |
| Interquartile Range (IQR) | 13.5% | 8.3% |
| Standard Deviation (Sample) | 10.0% | 7.5% |
| Standard Deviation (Population) | 9.9% | 7.5% |
Demographics Similar to Immigrants from Denmark and Immigrants from Pakistan by 3 or more Vehicles in Household
In terms of 3 or more vehicles in household, the demographic groups most similar to Immigrants from Denmark are Peruvian (19.6%, a difference of 0.090%), Ukrainian (19.6%, a difference of 0.10%), Iraqi (19.6%, a difference of 0.13%), Immigrants from Cameroon (19.7%, a difference of 0.25%), and Immigrants from Costa Rica (19.7%, a difference of 0.33%). Similarly, the demographic groups most similar to Immigrants from Pakistan are Armenian (19.8%, a difference of 0.050%), Immigrants from Lebanon (19.8%, a difference of 0.050%), Hungarian (19.8%, a difference of 0.21%), Immigrants from Guatemala (19.7%, a difference of 0.22%), and Thai (19.8%, a difference of 0.26%).
| Demographics | Rating | Rank | 3 or more Vehicles in Household |
| Immigrants | Jordan | 75.0 /100 | #154 | Good 19.9% |
| Tlingit-Haida | 73.4 /100 | #155 | Good 19.9% |
| Thais | 71.1 /100 | #156 | Good 19.8% |
| Hungarians | 70.5 /100 | #157 | Good 19.8% |
| Armenians | 68.8 /100 | #158 | Good 19.8% |
| Immigrants | Pakistan | 68.2 /100 | #159 | Good 19.8% |
| Immigrants | Lebanon | 67.6 /100 | #160 | Good 19.8% |
| Immigrants | Guatemala | 65.6 /100 | #161 | Good 19.7% |
| Estonians | 63.2 /100 | #162 | Good 19.7% |
| Chileans | 63.0 /100 | #163 | Good 19.7% |
| Yugoslavians | 62.9 /100 | #164 | Good 19.7% |
| Immigrants | Costa Rica | 61.9 /100 | #165 | Good 19.7% |
| Immigrants | Cameroon | 60.9 /100 | #166 | Good 19.7% |
| Ukrainians | 58.9 /100 | #167 | Average 19.6% |
| Peruvians | 58.8 /100 | #168 | Average 19.6% |
| Immigrants | Denmark | 57.6 /100 | #169 | Average 19.6% |
| Iraqis | 56.0 /100 | #170 | Average 19.6% |
| Immigrants | Western Europe | 53.2 /100 | #171 | Average 19.5% |
| Kiowa | 50.9 /100 | #172 | Average 19.5% |
| Immigrants | Northern Europe | 50.2 /100 | #173 | Average 19.5% |
| Immigrants | South Africa | 50.0 /100 | #174 | Average 19.5% |