Bolivian vs Immigrants from Liberia 2 or more Vehicles in Household
COMPARE
Bolivian
Immigrants from Liberia
2 or more Vehicles in Household
2 or more Vehicles in Household Comparison
Bolivians
Immigrants from Liberia
58.3%
2 OR MORE VEHICLES IN HOUSEHOLD
99.6/ 100
METRIC RATING
73rd/ 347
METRIC RANK
51.3%
2 OR MORE VEHICLES IN HOUSEHOLD
0.1/ 100
METRIC RATING
286th/ 347
METRIC RANK
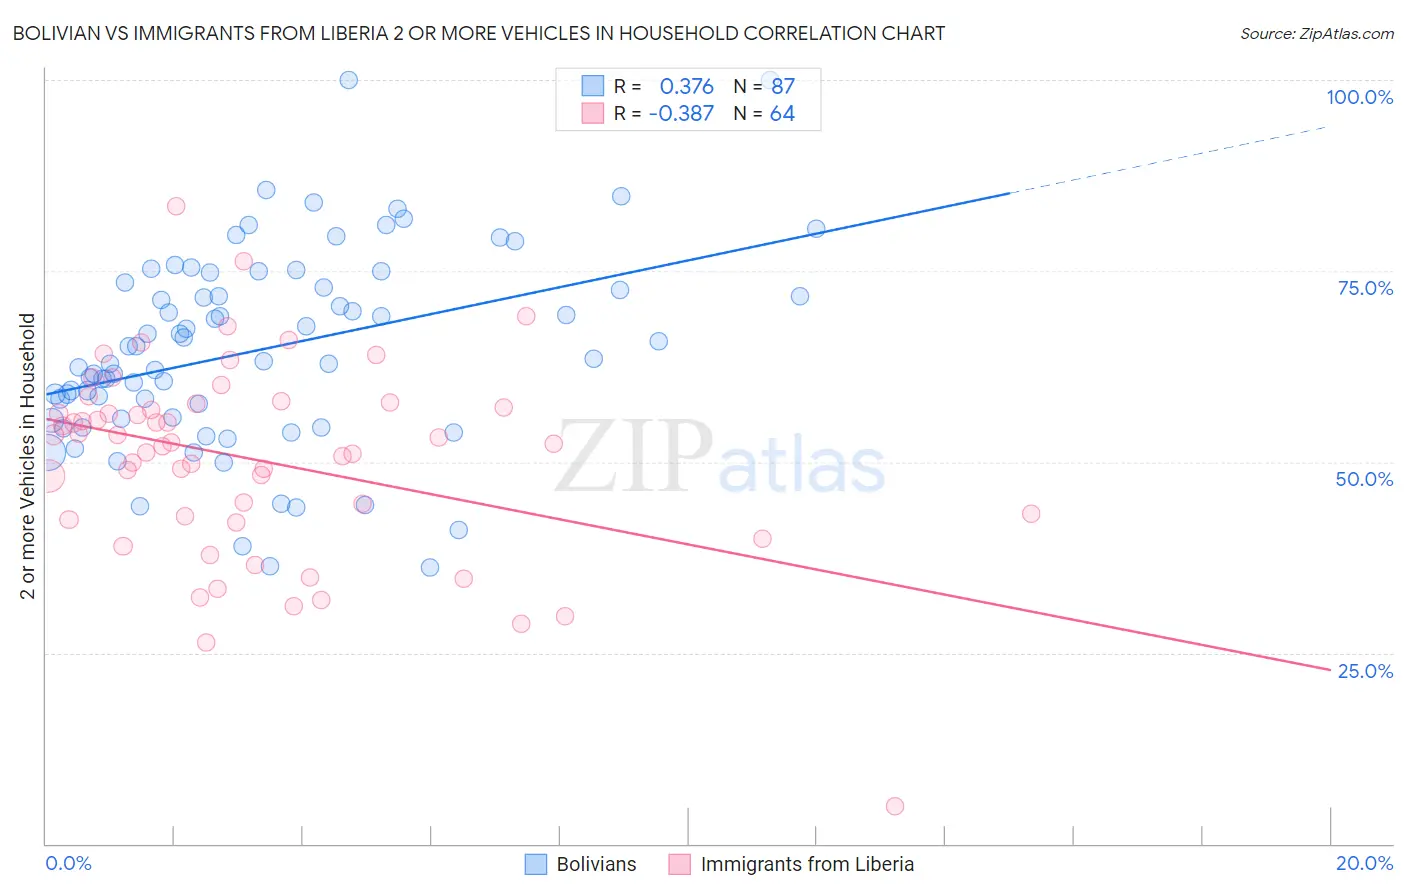
Bolivian vs Immigrants from Liberia 2 or more Vehicles in Household Correlation Chart
The statistical analysis conducted on geographies consisting of 184,629,947 people shows a mild positive correlation between the proportion of Bolivians and percentage of households with 2 or more vehicles available in the United States with a correlation coefficient (R) of 0.376 and weighted average of 58.3%. Similarly, the statistical analysis conducted on geographies consisting of 135,251,590 people shows a mild negative correlation between the proportion of Immigrants from Liberia and percentage of households with 2 or more vehicles available in the United States with a correlation coefficient (R) of -0.387 and weighted average of 51.3%, a difference of 13.7%.
2 or more Vehicles in Household Correlation Summary
| Measurement | Bolivian | Immigrants from Liberia |
| Minimum | 36.2% | 4.9% |
| Maximum | 100.0% | 83.5% |
| Range | 63.8% | 78.6% |
| Mean | 64.7% | 50.3% |
| Median | 63.5% | 52.4% |
| Interquartile 25% (IQ1) | 55.7% | 42.7% |
| Interquartile 75% (IQ3) | 73.5% | 57.4% |
| Interquartile Range (IQR) | 17.9% | 14.7% |
| Standard Deviation (Sample) | 12.9% | 13.0% |
| Standard Deviation (Population) | 12.8% | 12.9% |
Similar Demographics by 2 or more Vehicles in Household
Demographics Similar to Bolivians by 2 or more Vehicles in Household
In terms of 2 or more vehicles in household, the demographic groups most similar to Bolivians are Immigrants from Afghanistan (58.3%, a difference of 0.0%), Polish (58.3%, a difference of 0.080%), Austrian (58.4%, a difference of 0.12%), Creek (58.3%, a difference of 0.12%), and Slovene (58.3%, a difference of 0.12%).
| Demographics | Rating | Rank | 2 or more Vehicles in Household |
| Croatians | 99.7 /100 | #66 | Exceptional 58.6% |
| Laotians | 99.7 /100 | #67 | Exceptional 58.6% |
| Canadians | 99.7 /100 | #68 | Exceptional 58.6% |
| Pennsylvania Germans | 99.7 /100 | #69 | Exceptional 58.5% |
| Italians | 99.6 /100 | #70 | Exceptional 58.4% |
| Bangladeshis | 99.6 /100 | #71 | Exceptional 58.4% |
| Austrians | 99.6 /100 | #72 | Exceptional 58.4% |
| Bolivians | 99.6 /100 | #73 | Exceptional 58.3% |
| Immigrants | Afghanistan | 99.6 /100 | #74 | Exceptional 58.3% |
| Poles | 99.5 /100 | #75 | Exceptional 58.3% |
| Creek | 99.5 /100 | #76 | Exceptional 58.3% |
| Slovenes | 99.5 /100 | #77 | Exceptional 58.3% |
| Lithuanians | 99.5 /100 | #78 | Exceptional 58.2% |
| Delaware | 99.4 /100 | #79 | Exceptional 58.2% |
| Immigrants | England | 99.3 /100 | #80 | Exceptional 58.1% |
Demographics Similar to Immigrants from Liberia by 2 or more Vehicles in Household
In terms of 2 or more vehicles in household, the demographic groups most similar to Immigrants from Liberia are Immigrants from Serbia (51.3%, a difference of 0.020%), Immigrants from Uruguay (51.4%, a difference of 0.14%), Okinawan (51.2%, a difference of 0.14%), Immigrants from Zaire (51.5%, a difference of 0.30%), and Immigrants from China (51.5%, a difference of 0.34%).
| Demographics | Rating | Rank | 2 or more Vehicles in Household |
| Liberians | 0.1 /100 | #279 | Tragic 51.7% |
| Immigrants | Eastern Europe | 0.1 /100 | #280 | Tragic 51.7% |
| Immigrants | Kazakhstan | 0.1 /100 | #281 | Tragic 51.6% |
| Bahamians | 0.1 /100 | #282 | Tragic 51.5% |
| Immigrants | China | 0.1 /100 | #283 | Tragic 51.5% |
| Immigrants | Zaire | 0.1 /100 | #284 | Tragic 51.5% |
| Immigrants | Uruguay | 0.1 /100 | #285 | Tragic 51.4% |
| Immigrants | Liberia | 0.1 /100 | #286 | Tragic 51.3% |
| Immigrants | Serbia | 0.1 /100 | #287 | Tragic 51.3% |
| Okinawans | 0.1 /100 | #288 | Tragic 51.2% |
| Somalis | 0.0 /100 | #289 | Tragic 51.1% |
| Immigrants | Panama | 0.0 /100 | #290 | Tragic 51.1% |
| Belizeans | 0.0 /100 | #291 | Tragic 51.0% |
| Immigrants | Ukraine | 0.0 /100 | #292 | Tragic 50.9% |
| Blacks/African Americans | 0.0 /100 | #293 | Tragic 50.9% |