Immigrants from Caribbean vs Kenyan Family Households
COMPARE
Immigrants from Caribbean
Kenyan
Family Households
Family Households Comparison
Immigrants from Caribbean
Kenyans
65.3%
FAMILY HOUSEHOLDS
99.1/ 100
METRIC RATING
89th/ 347
METRIC RANK
63.2%
FAMILY HOUSEHOLDS
0.5/ 100
METRIC RATING
264th/ 347
METRIC RANK
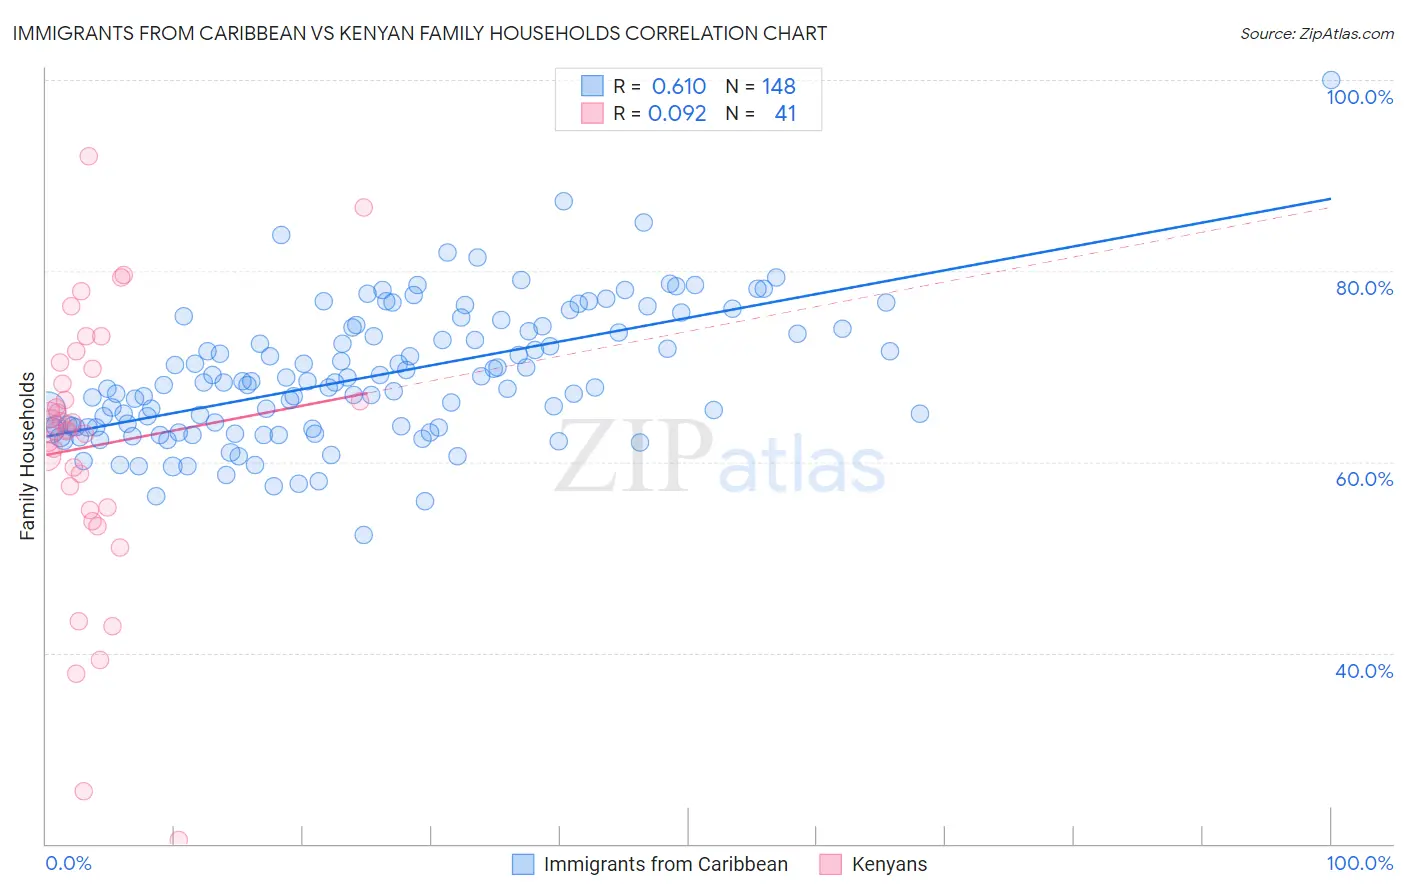
Immigrants from Caribbean vs Kenyan Family Households Correlation Chart
The statistical analysis conducted on geographies consisting of 449,694,372 people shows a significant positive correlation between the proportion of Immigrants from Caribbean and percentage of family households in the United States with a correlation coefficient (R) of 0.610 and weighted average of 65.3%. Similarly, the statistical analysis conducted on geographies consisting of 168,172,574 people shows a slight positive correlation between the proportion of Kenyans and percentage of family households in the United States with a correlation coefficient (R) of 0.092 and weighted average of 63.2%, a difference of 3.4%.
Family Households Correlation Summary
| Measurement | Immigrants from Caribbean | Kenyan |
| Minimum | 52.4% | 20.4% |
| Maximum | 100.0% | 92.0% |
| Range | 47.6% | 71.6% |
| Mean | 68.9% | 61.7% |
| Median | 68.2% | 63.4% |
| Interquartile 25% (IQ1) | 63.6% | 55.1% |
| Interquartile 75% (IQ3) | 73.8% | 70.1% |
| Interquartile Range (IQR) | 10.2% | 14.9% |
| Standard Deviation (Sample) | 7.1% | 14.5% |
| Standard Deviation (Population) | 7.1% | 14.4% |
Similar Demographics by Family Households
Demographics Similar to Immigrants from Caribbean by Family Households
In terms of family households, the demographic groups most similar to Immigrants from Caribbean are Immigrants from Haiti (65.3%, a difference of 0.010%), Immigrants from Laos (65.3%, a difference of 0.010%), Immigrants from Egypt (65.3%, a difference of 0.040%), Crow (65.3%, a difference of 0.060%), and Hopi (65.3%, a difference of 0.10%).
| Demographics | Rating | Rank | Family Households |
| Immigrants | Lebanon | 99.7 /100 | #82 | Exceptional 65.5% |
| Immigrants | Guyana | 99.6 /100 | #83 | Exceptional 65.5% |
| Americans | 99.6 /100 | #84 | Exceptional 65.5% |
| Immigrants | Cambodia | 99.5 /100 | #85 | Exceptional 65.4% |
| Egyptians | 99.4 /100 | #86 | Exceptional 65.4% |
| Immigrants | Egypt | 99.2 /100 | #87 | Exceptional 65.3% |
| Immigrants | Haiti | 99.1 /100 | #88 | Exceptional 65.3% |
| Immigrants | Caribbean | 99.1 /100 | #89 | Exceptional 65.3% |
| Immigrants | Laos | 99.1 /100 | #90 | Exceptional 65.3% |
| Crow | 98.9 /100 | #91 | Exceptional 65.3% |
| Hopi | 98.8 /100 | #92 | Exceptional 65.3% |
| Guyanese | 98.8 /100 | #93 | Exceptional 65.3% |
| Immigrants | Poland | 98.7 /100 | #94 | Exceptional 65.2% |
| Immigrants | Portugal | 98.6 /100 | #95 | Exceptional 65.2% |
| Swiss | 98.6 /100 | #96 | Exceptional 65.2% |
Demographics Similar to Kenyans by Family Households
In terms of family households, the demographic groups most similar to Kenyans are Cheyenne (63.2%, a difference of 0.010%), Colville (63.2%, a difference of 0.010%), Immigrants from Western Africa (63.1%, a difference of 0.020%), Immigrants from Ireland (63.2%, a difference of 0.030%), and Immigrants from Russia (63.2%, a difference of 0.040%).
| Demographics | Rating | Rank | Family Households |
| Icelanders | 0.8 /100 | #257 | Tragic 63.3% |
| Immigrants | Barbados | 0.7 /100 | #258 | Tragic 63.2% |
| Immigrants | Western Europe | 0.6 /100 | #259 | Tragic 63.2% |
| Cypriots | 0.6 /100 | #260 | Tragic 63.2% |
| Immigrants | Russia | 0.6 /100 | #261 | Tragic 63.2% |
| Immigrants | Ireland | 0.6 /100 | #262 | Tragic 63.2% |
| Cheyenne | 0.5 /100 | #263 | Tragic 63.2% |
| Kenyans | 0.5 /100 | #264 | Tragic 63.2% |
| Colville | 0.5 /100 | #265 | Tragic 63.2% |
| Immigrants | Western Africa | 0.5 /100 | #266 | Tragic 63.1% |
| Israelis | 0.4 /100 | #267 | Tragic 63.1% |
| Immigrants | Singapore | 0.4 /100 | #268 | Tragic 63.1% |
| Yugoslavians | 0.4 /100 | #269 | Tragic 63.1% |
| Immigrants | Austria | 0.3 /100 | #270 | Tragic 63.1% |
| Immigrants | Croatia | 0.3 /100 | #271 | Tragic 63.1% |