Immigrants from Caribbean vs Kenyan College, Under 1 year
COMPARE
Immigrants from Caribbean
Kenyan
College, Under 1 year
College, Under 1 year Comparison
Immigrants from Caribbean
Kenyans
56.6%
COLLEGE, UNDER 1 YEAR
0.0/ 100
METRIC RATING
322nd/ 347
METRIC RANK
66.5%
COLLEGE, UNDER 1 YEAR
81.7/ 100
METRIC RATING
146th/ 347
METRIC RANK
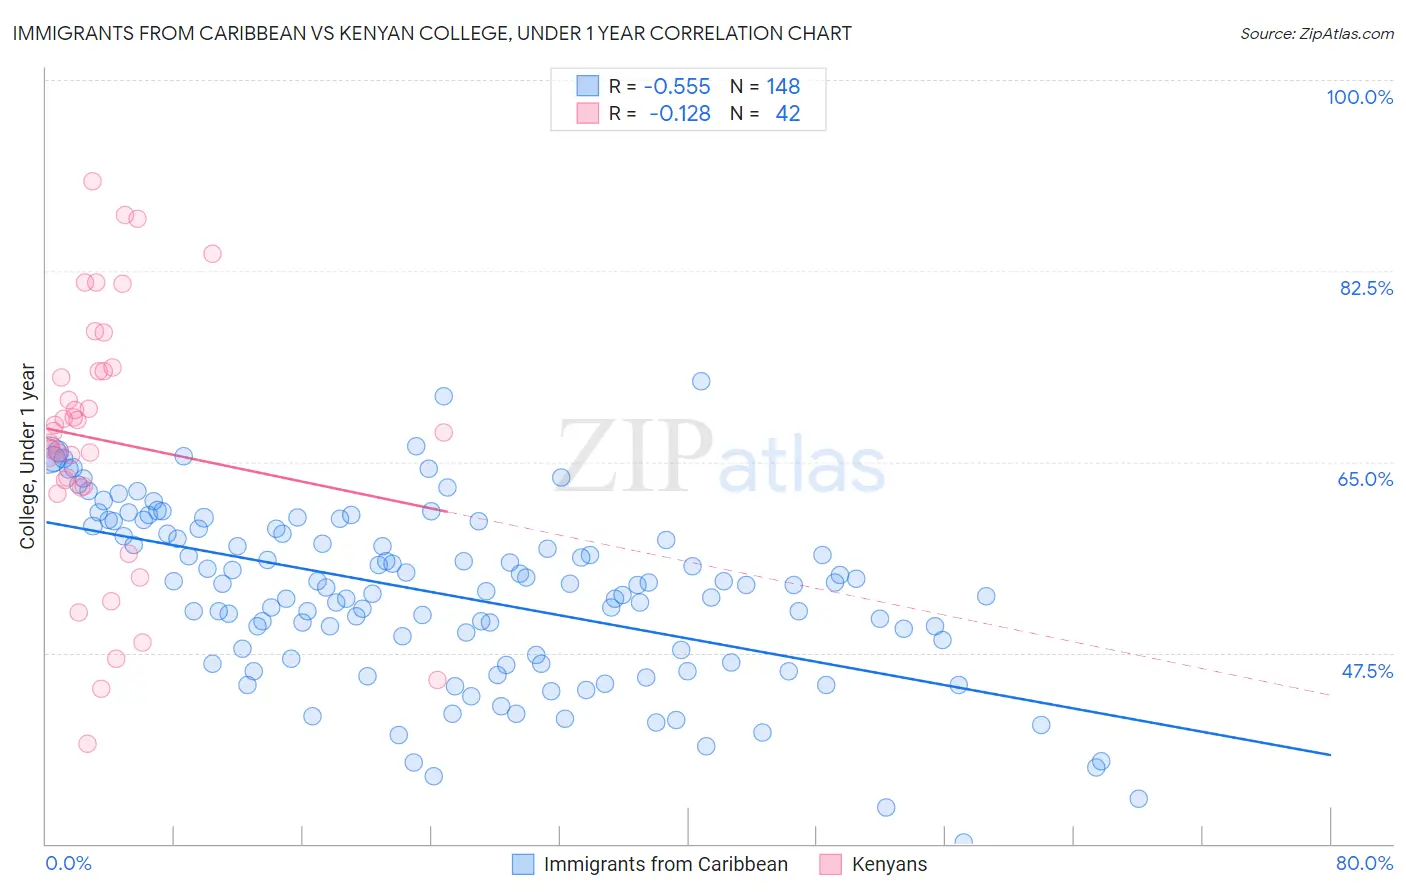
Immigrants from Caribbean vs Kenyan College, Under 1 year Correlation Chart
The statistical analysis conducted on geographies consisting of 450,062,086 people shows a substantial negative correlation between the proportion of Immigrants from Caribbean and percentage of population with at least college, under 1 year education in the United States with a correlation coefficient (R) of -0.555 and weighted average of 56.6%. Similarly, the statistical analysis conducted on geographies consisting of 168,244,481 people shows a poor negative correlation between the proportion of Kenyans and percentage of population with at least college, under 1 year education in the United States with a correlation coefficient (R) of -0.128 and weighted average of 66.5%, a difference of 17.5%.
College, Under 1 year Correlation Summary
| Measurement | Immigrants from Caribbean | Kenyan |
| Minimum | 30.2% | 39.1% |
| Maximum | 72.4% | 90.7% |
| Range | 42.2% | 51.6% |
| Mean | 52.8% | 66.9% |
| Median | 53.7% | 67.8% |
| Interquartile 25% (IQ1) | 47.1% | 62.7% |
| Interquartile 75% (IQ3) | 58.6% | 73.3% |
| Interquartile Range (IQR) | 11.5% | 10.6% |
| Standard Deviation (Sample) | 7.9% | 12.2% |
| Standard Deviation (Population) | 7.9% | 12.0% |
Similar Demographics by College, Under 1 year
Demographics Similar to Immigrants from Caribbean by College, Under 1 year
In terms of college, under 1 year, the demographic groups most similar to Immigrants from Caribbean are Native/Alaskan (56.6%, a difference of 0.13%), Immigrants from Honduras (56.5%, a difference of 0.18%), Immigrants from El Salvador (56.4%, a difference of 0.31%), Guatemalan (56.8%, a difference of 0.39%), and Immigrants from Latin America (56.3%, a difference of 0.41%).
| Demographics | Rating | Rank | College, Under 1 year |
| Hondurans | 0.0 /100 | #315 | Tragic 57.1% |
| Menominee | 0.0 /100 | #316 | Tragic 57.0% |
| Hispanics or Latinos | 0.0 /100 | #317 | Tragic 57.0% |
| Immigrants | Haiti | 0.0 /100 | #318 | Tragic 56.9% |
| Puerto Ricans | 0.0 /100 | #319 | Tragic 56.8% |
| Guatemalans | 0.0 /100 | #320 | Tragic 56.8% |
| Natives/Alaskans | 0.0 /100 | #321 | Tragic 56.6% |
| Immigrants | Caribbean | 0.0 /100 | #322 | Tragic 56.6% |
| Immigrants | Honduras | 0.0 /100 | #323 | Tragic 56.5% |
| Immigrants | El Salvador | 0.0 /100 | #324 | Tragic 56.4% |
| Immigrants | Latin America | 0.0 /100 | #325 | Tragic 56.3% |
| Navajo | 0.0 /100 | #326 | Tragic 56.3% |
| Immigrants | Guatemala | 0.0 /100 | #327 | Tragic 56.2% |
| Cape Verdeans | 0.0 /100 | #328 | Tragic 56.0% |
| Immigrants | Cuba | 0.0 /100 | #329 | Tragic 55.7% |
Demographics Similar to Kenyans by College, Under 1 year
In terms of college, under 1 year, the demographic groups most similar to Kenyans are Immigrants from Kenya (66.5%, a difference of 0.0%), Immigrants from Morocco (66.5%, a difference of 0.0%), Immigrants from Germany (66.5%, a difference of 0.020%), Immigrants from Uganda (66.5%, a difference of 0.080%), and English (66.6%, a difference of 0.090%).
| Demographics | Rating | Rank | College, Under 1 year |
| Venezuelans | 85.9 /100 | #139 | Excellent 66.7% |
| Slavs | 85.9 /100 | #140 | Excellent 66.7% |
| Immigrants | Afghanistan | 85.1 /100 | #141 | Excellent 66.7% |
| English | 82.9 /100 | #142 | Excellent 66.6% |
| Immigrants | Uganda | 82.8 /100 | #143 | Excellent 66.5% |
| Immigrants | Germany | 82.0 /100 | #144 | Excellent 66.5% |
| Immigrants | Kenya | 81.8 /100 | #145 | Excellent 66.5% |
| Kenyans | 81.7 /100 | #146 | Excellent 66.5% |
| Immigrants | Morocco | 81.7 /100 | #147 | Excellent 66.5% |
| Taiwanese | 78.6 /100 | #148 | Good 66.4% |
| Immigrants | Venezuela | 77.9 /100 | #149 | Good 66.3% |
| Immigrants | Iraq | 77.1 /100 | #150 | Good 66.3% |
| Immigrants | Sudan | 76.0 /100 | #151 | Good 66.2% |
| Sudanese | 74.1 /100 | #152 | Good 66.2% |
| Belgians | 73.7 /100 | #153 | Good 66.2% |