Immigrants from Cabo Verde vs Guyanese Unemployment Among Ages 35 to 44 years
COMPARE
Immigrants from Cabo Verde
Guyanese
Unemployment Among Ages 35 to 44 years
Unemployment Among Ages 35 to 44 years Comparison
Immigrants from Cabo Verde
Guyanese
6.9%
UNEMPLOYMENT AMONG AGES 35 TO 44 YEARS
0.0/ 100
METRIC RATING
330th/ 347
METRIC RANK
5.9%
UNEMPLOYMENT AMONG AGES 35 TO 44 YEARS
0.0/ 100
METRIC RATING
310th/ 347
METRIC RANK
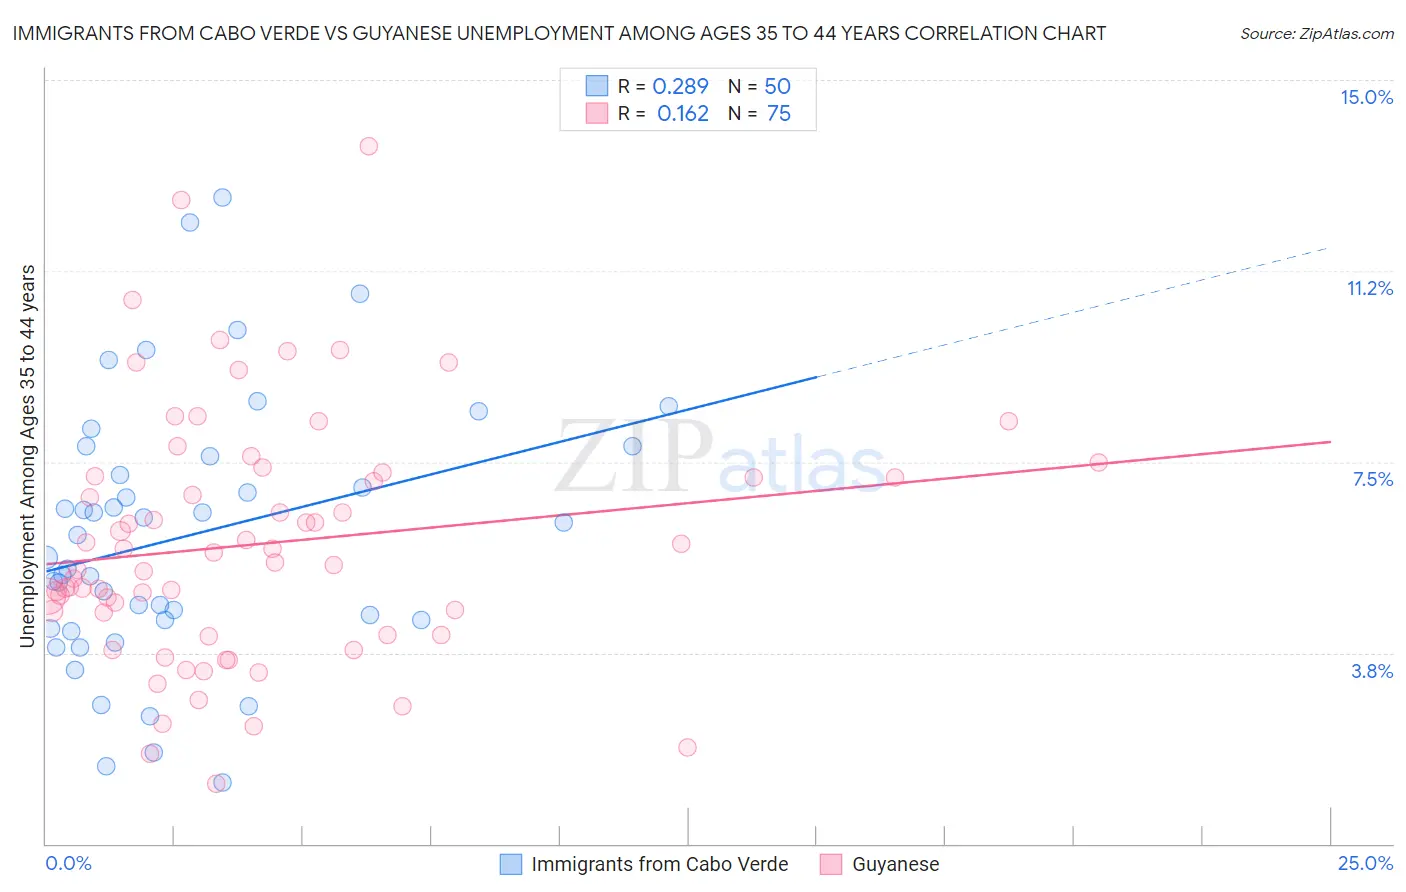
Immigrants from Cabo Verde vs Guyanese Unemployment Among Ages 35 to 44 years Correlation Chart
The statistical analysis conducted on geographies consisting of 37,842,833 people shows a weak positive correlation between the proportion of Immigrants from Cabo Verde and unemployment rate among population between the ages 35 and 44 in the United States with a correlation coefficient (R) of 0.289 and weighted average of 6.9%. Similarly, the statistical analysis conducted on geographies consisting of 175,131,214 people shows a poor positive correlation between the proportion of Guyanese and unemployment rate among population between the ages 35 and 44 in the United States with a correlation coefficient (R) of 0.162 and weighted average of 5.9%, a difference of 16.9%.
Unemployment Among Ages 35 to 44 years Correlation Summary
| Measurement | Immigrants from Cabo Verde | Guyanese |
| Minimum | 1.2% | 1.2% |
| Maximum | 12.7% | 13.7% |
| Range | 11.5% | 12.5% |
| Mean | 6.0% | 5.9% |
| Median | 5.9% | 5.5% |
| Interquartile 25% (IQ1) | 4.4% | 4.1% |
| Interquartile 75% (IQ3) | 7.6% | 7.2% |
| Interquartile Range (IQR) | 3.2% | 3.1% |
| Standard Deviation (Sample) | 2.6% | 2.4% |
| Standard Deviation (Population) | 2.6% | 2.4% |
Demographics Similar to Immigrants from Cabo Verde and Guyanese by Unemployment Among Ages 35 to 44 years
In terms of unemployment among ages 35 to 44 years, the demographic groups most similar to Immigrants from Cabo Verde are Paiute (6.9%, a difference of 0.020%), Shoshone (6.6%, a difference of 4.1%), Cape Verdean (6.6%, a difference of 4.8%), Alaska Native (6.6%, a difference of 4.9%), and Immigrants from Yemen (6.6%, a difference of 5.0%). Similarly, the demographic groups most similar to Guyanese are Marshallese (5.9%, a difference of 0.27%), Immigrants from Guyana (6.0%, a difference of 1.4%), British West Indian (6.0%, a difference of 1.5%), Immigrants from Dominica (6.0%, a difference of 1.9%), and Black/African American (6.1%, a difference of 3.7%).
| Demographics | Rating | Rank | Unemployment Among Ages 35 to 44 years |
| Guyanese | 0.0 /100 | #310 | Tragic 5.9% |
| Marshallese | 0.0 /100 | #311 | Tragic 5.9% |
| Immigrants | Guyana | 0.0 /100 | #312 | Tragic 6.0% |
| British West Indians | 0.0 /100 | #313 | Tragic 6.0% |
| Immigrants | Dominica | 0.0 /100 | #314 | Tragic 6.0% |
| Blacks/African Americans | 0.0 /100 | #315 | Tragic 6.1% |
| Tsimshian | 0.0 /100 | #316 | Tragic 6.2% |
| Immigrants | St. Vincent and the Grenadines | 0.0 /100 | #317 | Tragic 6.2% |
| Colville | 0.0 /100 | #318 | Tragic 6.2% |
| Immigrants | Grenada | 0.0 /100 | #319 | Tragic 6.2% |
| Immigrants | Armenia | 0.0 /100 | #320 | Tragic 6.2% |
| Chippewa | 0.0 /100 | #321 | Tragic 6.2% |
| Immigrants | Dominican Republic | 0.0 /100 | #322 | Tragic 6.4% |
| Dominicans | 0.0 /100 | #323 | Tragic 6.4% |
| Menominee | 0.0 /100 | #324 | Tragic 6.5% |
| Immigrants | Yemen | 0.0 /100 | #325 | Tragic 6.6% |
| Alaska Natives | 0.0 /100 | #326 | Tragic 6.6% |
| Cape Verdeans | 0.0 /100 | #327 | Tragic 6.6% |
| Shoshone | 0.0 /100 | #328 | Tragic 6.6% |
| Paiute | 0.0 /100 | #329 | Tragic 6.9% |
| Immigrants | Cabo Verde | 0.0 /100 | #330 | Tragic 6.9% |