Immigrants from Cabo Verde vs Guyanese GED/Equivalency
COMPARE
Immigrants from Cabo Verde
Guyanese
GED/Equivalency
GED/Equivalency Comparison
Immigrants from Cabo Verde
Guyanese
78.9%
GED/EQUIVALENCY
0.0/ 100
METRIC RATING
330th/ 347
METRIC RANK
81.3%
GED/EQUIVALENCY
0.0/ 100
METRIC RATING
306th/ 347
METRIC RANK
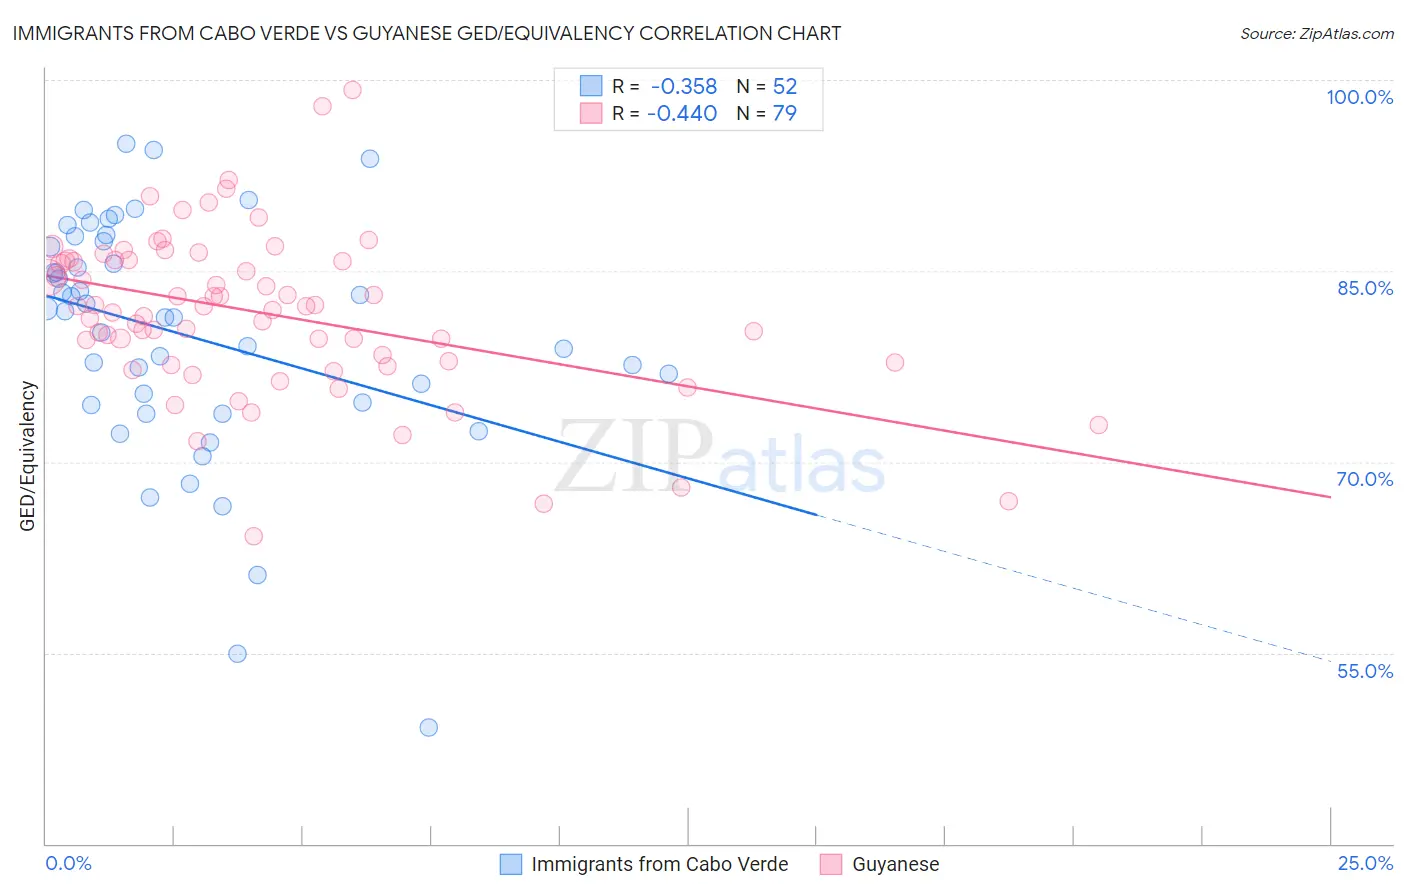
Immigrants from Cabo Verde vs Guyanese GED/Equivalency Correlation Chart
The statistical analysis conducted on geographies consisting of 38,158,504 people shows a mild negative correlation between the proportion of Immigrants from Cabo Verde and percentage of population with at least ged/equivalency education in the United States with a correlation coefficient (R) of -0.358 and weighted average of 78.9%. Similarly, the statistical analysis conducted on geographies consisting of 176,940,942 people shows a moderate negative correlation between the proportion of Guyanese and percentage of population with at least ged/equivalency education in the United States with a correlation coefficient (R) of -0.440 and weighted average of 81.3%, a difference of 3.0%.
GED/Equivalency Correlation Summary
| Measurement | Immigrants from Cabo Verde | Guyanese |
| Minimum | 49.2% | 64.1% |
| Maximum | 95.0% | 99.2% |
| Range | 45.8% | 35.1% |
| Mean | 79.9% | 81.7% |
| Median | 81.6% | 82.2% |
| Interquartile 25% (IQ1) | 74.6% | 77.8% |
| Interquartile 75% (IQ3) | 87.1% | 85.9% |
| Interquartile Range (IQR) | 12.6% | 8.1% |
| Standard Deviation (Sample) | 9.5% | 6.4% |
| Standard Deviation (Population) | 9.4% | 6.3% |
Similar Demographics by GED/Equivalency
Demographics Similar to Immigrants from Cabo Verde by GED/Equivalency
In terms of ged/equivalency, the demographic groups most similar to Immigrants from Cabo Verde are Dominican (79.1%, a difference of 0.16%), Hispanic or Latino (79.1%, a difference of 0.20%), Immigrants from Honduras (78.7%, a difference of 0.24%), Central American (79.2%, a difference of 0.31%), and Yuman (79.2%, a difference of 0.33%).
| Demographics | Rating | Rank | GED/Equivalency |
| Immigrants | Nicaragua | 0.0 /100 | #323 | Tragic 79.9% |
| Mexican American Indians | 0.0 /100 | #324 | Tragic 79.4% |
| Hondurans | 0.0 /100 | #325 | Tragic 79.3% |
| Yuman | 0.0 /100 | #326 | Tragic 79.2% |
| Central Americans | 0.0 /100 | #327 | Tragic 79.2% |
| Hispanics or Latinos | 0.0 /100 | #328 | Tragic 79.1% |
| Dominicans | 0.0 /100 | #329 | Tragic 79.1% |
| Immigrants | Cabo Verde | 0.0 /100 | #330 | Tragic 78.9% |
| Immigrants | Honduras | 0.0 /100 | #331 | Tragic 78.7% |
| Immigrants | Azores | 0.0 /100 | #332 | Tragic 78.7% |
| Salvadorans | 0.0 /100 | #333 | Tragic 78.6% |
| Guatemalans | 0.0 /100 | #334 | Tragic 78.5% |
| Immigrants | Latin America | 0.0 /100 | #335 | Tragic 78.5% |
| Immigrants | Dominican Republic | 0.0 /100 | #336 | Tragic 78.0% |
| Immigrants | Yemen | 0.0 /100 | #337 | Tragic 77.9% |
Demographics Similar to Guyanese by GED/Equivalency
In terms of ged/equivalency, the demographic groups most similar to Guyanese are Immigrants from Grenada (81.3%, a difference of 0.020%), Immigrants from Dominica (81.1%, a difference of 0.17%), Navajo (81.5%, a difference of 0.23%), Puerto Rican (81.1%, a difference of 0.28%), and Immigrants from Haiti (81.6%, a difference of 0.33%).
| Demographics | Rating | Rank | GED/Equivalency |
| Ecuadorians | 0.0 /100 | #299 | Tragic 81.7% |
| Fijians | 0.0 /100 | #300 | Tragic 81.6% |
| Dutch West Indians | 0.0 /100 | #301 | Tragic 81.6% |
| Immigrants | Haiti | 0.0 /100 | #302 | Tragic 81.6% |
| Immigrants | Portugal | 0.0 /100 | #303 | Tragic 81.6% |
| Navajo | 0.0 /100 | #304 | Tragic 81.5% |
| Immigrants | Grenada | 0.0 /100 | #305 | Tragic 81.3% |
| Guyanese | 0.0 /100 | #306 | Tragic 81.3% |
| Immigrants | Dominica | 0.0 /100 | #307 | Tragic 81.1% |
| Puerto Ricans | 0.0 /100 | #308 | Tragic 81.1% |
| Immigrants | Ecuador | 0.0 /100 | #309 | Tragic 81.0% |
| Immigrants | Guyana | 0.0 /100 | #310 | Tragic 81.0% |
| Natives/Alaskans | 0.0 /100 | #311 | Tragic 80.9% |
| Nicaraguans | 0.0 /100 | #312 | Tragic 80.9% |
| Cape Verdeans | 0.0 /100 | #313 | Tragic 80.9% |