Immigrants from Bolivia vs Romanian Median Female Earnings
COMPARE
Immigrants from Bolivia
Romanian
Median Female Earnings
Median Female Earnings Comparison
Immigrants from Bolivia
Romanians
$43,467
MEDIAN FEMALE EARNINGS
100.0/ 100
METRIC RATING
46th/ 347
METRIC RANK
$41,663
MEDIAN FEMALE EARNINGS
98.3/ 100
METRIC RATING
100th/ 347
METRIC RANK
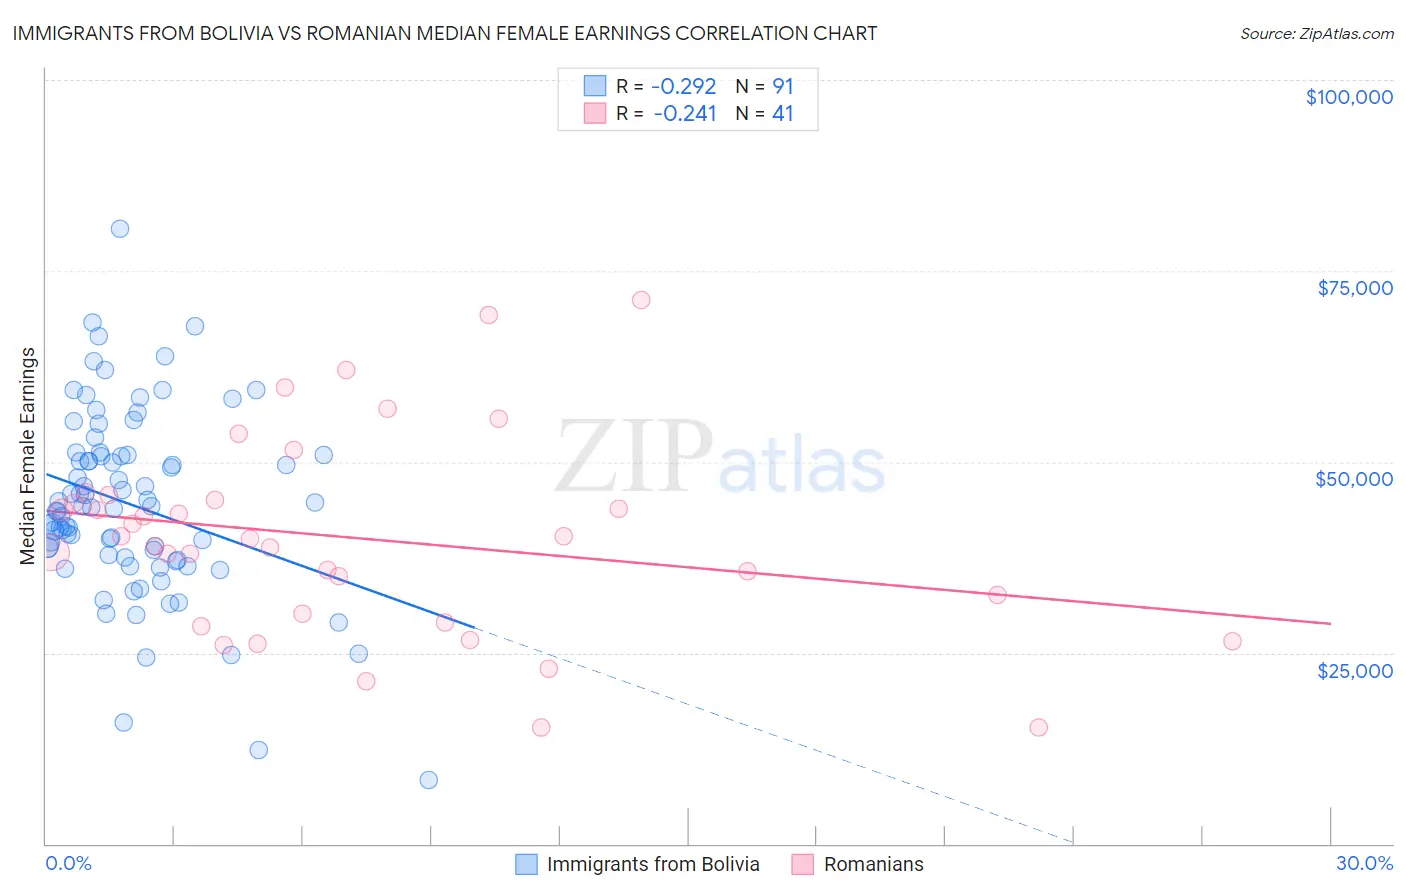
Immigrants from Bolivia vs Romanian Median Female Earnings Correlation Chart
The statistical analysis conducted on geographies consisting of 158,712,262 people shows a weak negative correlation between the proportion of Immigrants from Bolivia and median female earnings in the United States with a correlation coefficient (R) of -0.292 and weighted average of $43,467. Similarly, the statistical analysis conducted on geographies consisting of 377,764,686 people shows a weak negative correlation between the proportion of Romanians and median female earnings in the United States with a correlation coefficient (R) of -0.241 and weighted average of $41,663, a difference of 4.3%.
Median Female Earnings Correlation Summary
| Measurement | Immigrants from Bolivia | Romanian |
| Minimum | $8,362 | $15,248 |
| Maximum | $80,500 | $71,250 |
| Range | $72,138 | $56,002 |
| Mean | $44,359 | $39,999 |
| Median | $43,989 | $39,890 |
| Interquartile 25% (IQ1) | $37,479 | $29,536 |
| Interquartile 75% (IQ3) | $50,958 | $45,366 |
| Interquartile Range (IQR) | $13,479 | $15,830 |
| Standard Deviation (Sample) | $12,073 | $13,074 |
| Standard Deviation (Population) | $12,007 | $12,914 |
Similar Demographics by Median Female Earnings
Demographics Similar to Immigrants from Bolivia by Median Female Earnings
In terms of median female earnings, the demographic groups most similar to Immigrants from Bolivia are Bolivian ($43,445, a difference of 0.050%), Immigrants from Europe ($43,523, a difference of 0.13%), Immigrants from Indonesia ($43,412, a difference of 0.13%), Immigrants from Serbia ($43,385, a difference of 0.19%), and Immigrants from Czechoslovakia ($43,571, a difference of 0.24%).
| Demographics | Rating | Rank | Median Female Earnings |
| Israelis | 100.0 /100 | #39 | Exceptional $43,852 |
| Immigrants | Malaysia | 100.0 /100 | #40 | Exceptional $43,835 |
| Bhutanese | 100.0 /100 | #41 | Exceptional $43,648 |
| Immigrants | Denmark | 100.0 /100 | #42 | Exceptional $43,646 |
| Bulgarians | 100.0 /100 | #43 | Exceptional $43,638 |
| Immigrants | Czechoslovakia | 100.0 /100 | #44 | Exceptional $43,571 |
| Immigrants | Europe | 100.0 /100 | #45 | Exceptional $43,523 |
| Immigrants | Bolivia | 100.0 /100 | #46 | Exceptional $43,467 |
| Bolivians | 100.0 /100 | #47 | Exceptional $43,445 |
| Immigrants | Indonesia | 100.0 /100 | #48 | Exceptional $43,412 |
| Immigrants | Serbia | 100.0 /100 | #49 | Exceptional $43,385 |
| Immigrants | Uzbekistan | 100.0 /100 | #50 | Exceptional $43,363 |
| Maltese | 100.0 /100 | #51 | Exceptional $43,357 |
| Immigrants | Lithuania | 99.9 /100 | #52 | Exceptional $43,317 |
| Immigrants | Eastern Europe | 99.9 /100 | #53 | Exceptional $43,309 |
Demographics Similar to Romanians by Median Female Earnings
In terms of median female earnings, the demographic groups most similar to Romanians are Immigrants from Fiji ($41,656, a difference of 0.020%), Immigrants from Barbados ($41,685, a difference of 0.050%), Immigrants from Poland ($41,630, a difference of 0.080%), Immigrants from Scotland ($41,771, a difference of 0.26%), and Immigrants from Argentina ($41,554, a difference of 0.26%).
| Demographics | Rating | Rank | Median Female Earnings |
| Immigrants | Grenada | 99.0 /100 | #93 | Exceptional $41,932 |
| Moroccans | 98.9 /100 | #94 | Exceptional $41,872 |
| Immigrants | Netherlands | 98.9 /100 | #95 | Exceptional $41,870 |
| South Africans | 98.8 /100 | #96 | Exceptional $41,825 |
| Immigrants | Hungary | 98.8 /100 | #97 | Exceptional $41,820 |
| Immigrants | Scotland | 98.7 /100 | #98 | Exceptional $41,771 |
| Immigrants | Barbados | 98.4 /100 | #99 | Exceptional $41,685 |
| Romanians | 98.3 /100 | #100 | Exceptional $41,663 |
| Immigrants | Fiji | 98.3 /100 | #101 | Exceptional $41,656 |
| Immigrants | Poland | 98.2 /100 | #102 | Exceptional $41,630 |
| Immigrants | Argentina | 97.9 /100 | #103 | Exceptional $41,554 |
| Immigrants | Zimbabwe | 97.8 /100 | #104 | Exceptional $41,527 |
| Italians | 97.7 /100 | #105 | Exceptional $41,505 |
| Immigrants | Eritrea | 97.6 /100 | #106 | Exceptional $41,485 |
| Palestinians | 97.6 /100 | #107 | Exceptional $41,484 |