Immigrants from Belize vs Cape Verdean 4 or more Vehicles in Household
COMPARE
Immigrants from Belize
Cape Verdean
4 or more Vehicles in Household
4 or more Vehicles in Household Comparison
Immigrants from Belize
Cape Verdeans
6.1%
4 OR MORE VEHICLES IN HOUSEHOLD
19.8/ 100
METRIC RATING
204th/ 347
METRIC RANK
4.4%
4 OR MORE VEHICLES IN HOUSEHOLD
0.0/ 100
METRIC RATING
326th/ 347
METRIC RANK
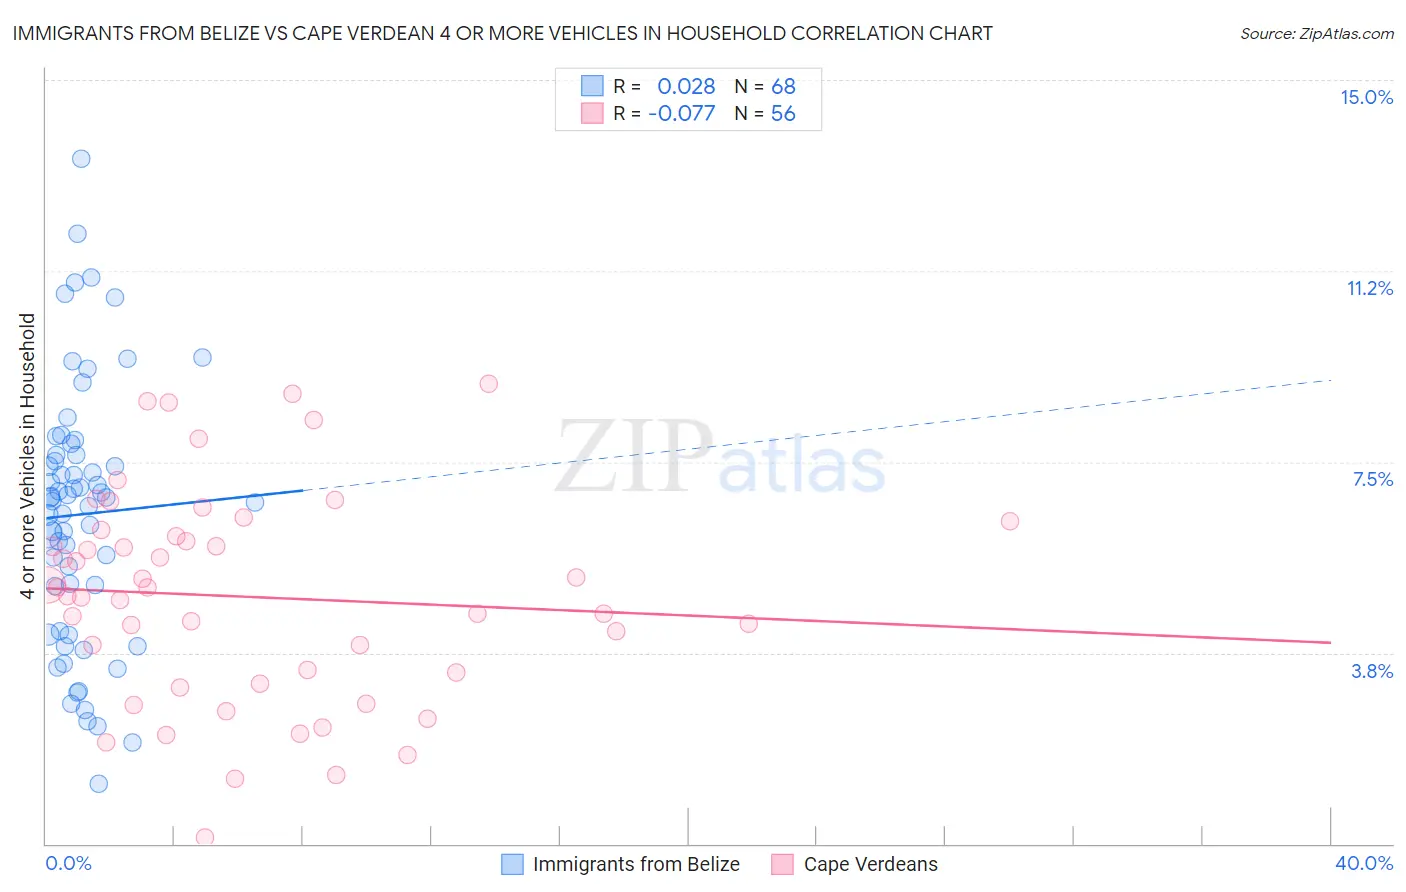
Immigrants from Belize vs Cape Verdean 4 or more Vehicles in Household Correlation Chart
The statistical analysis conducted on geographies consisting of 129,765,587 people shows no correlation between the proportion of Immigrants from Belize and percentage of households with 4 or more vehicles available in the United States with a correlation coefficient (R) of 0.028 and weighted average of 6.1%. Similarly, the statistical analysis conducted on geographies consisting of 107,262,408 people shows a slight negative correlation between the proportion of Cape Verdeans and percentage of households with 4 or more vehicles available in the United States with a correlation coefficient (R) of -0.077 and weighted average of 4.4%, a difference of 38.7%.
4 or more Vehicles in Household Correlation Summary
| Measurement | Immigrants from Belize | Cape Verdean |
| Minimum | 1.2% | 0.12% |
| Maximum | 13.4% | 9.0% |
| Range | 12.3% | 8.9% |
| Mean | 6.5% | 4.8% |
| Median | 6.8% | 4.9% |
| Interquartile 25% (IQ1) | 4.6% | 3.2% |
| Interquartile 75% (IQ3) | 7.6% | 6.1% |
| Interquartile Range (IQR) | 3.0% | 2.8% |
| Standard Deviation (Sample) | 2.5% | 2.1% |
| Standard Deviation (Population) | 2.5% | 2.1% |
Similar Demographics by 4 or more Vehicles in Household
Demographics Similar to Immigrants from Belize by 4 or more Vehicles in Household
In terms of 4 or more vehicles in household, the demographic groups most similar to Immigrants from Belize are Honduran (6.1%, a difference of 0.090%), Immigrants from Sierra Leone (6.1%, a difference of 0.10%), Kenyan (6.1%, a difference of 0.23%), Immigrants from South Central Asia (6.1%, a difference of 0.24%), and Egyptian (6.1%, a difference of 0.25%).
| Demographics | Rating | Rank | 4 or more Vehicles in Household |
| Immigrants | Sri Lanka | 23.7 /100 | #197 | Fair 6.1% |
| Immigrants | Portugal | 22.3 /100 | #198 | Fair 6.1% |
| Immigrants | Norway | 21.8 /100 | #199 | Fair 6.1% |
| Latvians | 21.7 /100 | #200 | Fair 6.1% |
| Egyptians | 21.4 /100 | #201 | Fair 6.1% |
| Immigrants | South Central Asia | 21.3 /100 | #202 | Fair 6.1% |
| Immigrants | Sierra Leone | 20.5 /100 | #203 | Fair 6.1% |
| Immigrants | Belize | 19.8 /100 | #204 | Poor 6.1% |
| Hondurans | 19.3 /100 | #205 | Poor 6.1% |
| Kenyans | 18.5 /100 | #206 | Poor 6.1% |
| Immigrants | Chile | 16.9 /100 | #207 | Poor 6.1% |
| Immigrants | Nigeria | 15.6 /100 | #208 | Poor 6.1% |
| Immigrants | Honduras | 15.4 /100 | #209 | Poor 6.1% |
| Immigrants | Zimbabwe | 15.1 /100 | #210 | Poor 6.0% |
| Panamanians | 14.8 /100 | #211 | Poor 6.0% |
Demographics Similar to Cape Verdeans by 4 or more Vehicles in Household
In terms of 4 or more vehicles in household, the demographic groups most similar to Cape Verdeans are Immigrants from Jamaica (4.4%, a difference of 0.32%), Soviet Union (4.4%, a difference of 0.64%), Immigrants from Caribbean (4.4%, a difference of 0.92%), Immigrants from Yemen (4.5%, a difference of 1.3%), and Ecuadorian (4.5%, a difference of 1.5%).
| Demographics | Rating | Rank | 4 or more Vehicles in Household |
| Haitians | 0.0 /100 | #319 | Tragic 4.6% |
| Immigrants | Haiti | 0.0 /100 | #320 | Tragic 4.5% |
| Ecuadorians | 0.0 /100 | #321 | Tragic 4.5% |
| Immigrants | Yemen | 0.0 /100 | #322 | Tragic 4.5% |
| Immigrants | Caribbean | 0.0 /100 | #323 | Tragic 4.4% |
| Soviet Union | 0.0 /100 | #324 | Tragic 4.4% |
| Immigrants | Jamaica | 0.0 /100 | #325 | Tragic 4.4% |
| Cape Verdeans | 0.0 /100 | #326 | Tragic 4.4% |
| Senegalese | 0.0 /100 | #327 | Tragic 4.3% |
| Trinidadians and Tobagonians | 0.0 /100 | #328 | Tragic 4.3% |
| Immigrants | Senegal | 0.0 /100 | #329 | Tragic 4.2% |
| Immigrants | Ecuador | 0.0 /100 | #330 | Tragic 4.2% |
| West Indians | 0.0 /100 | #331 | Tragic 4.2% |
| Immigrants | Dominica | 0.0 /100 | #332 | Tragic 4.2% |
| Immigrants | Albania | 0.0 /100 | #333 | Tragic 4.1% |