Immigrants from Belize vs Immigrants from Northern Europe 4 or more Vehicles in Household
COMPARE
Immigrants from Belize
Immigrants from Northern Europe
4 or more Vehicles in Household
4 or more Vehicles in Household Comparison
Immigrants from Belize
Immigrants from Northern Europe
6.1%
4 OR MORE VEHICLES IN HOUSEHOLD
19.8/ 100
METRIC RATING
204th/ 347
METRIC RANK
6.2%
4 OR MORE VEHICLES IN HOUSEHOLD
36.8/ 100
METRIC RATING
186th/ 347
METRIC RANK
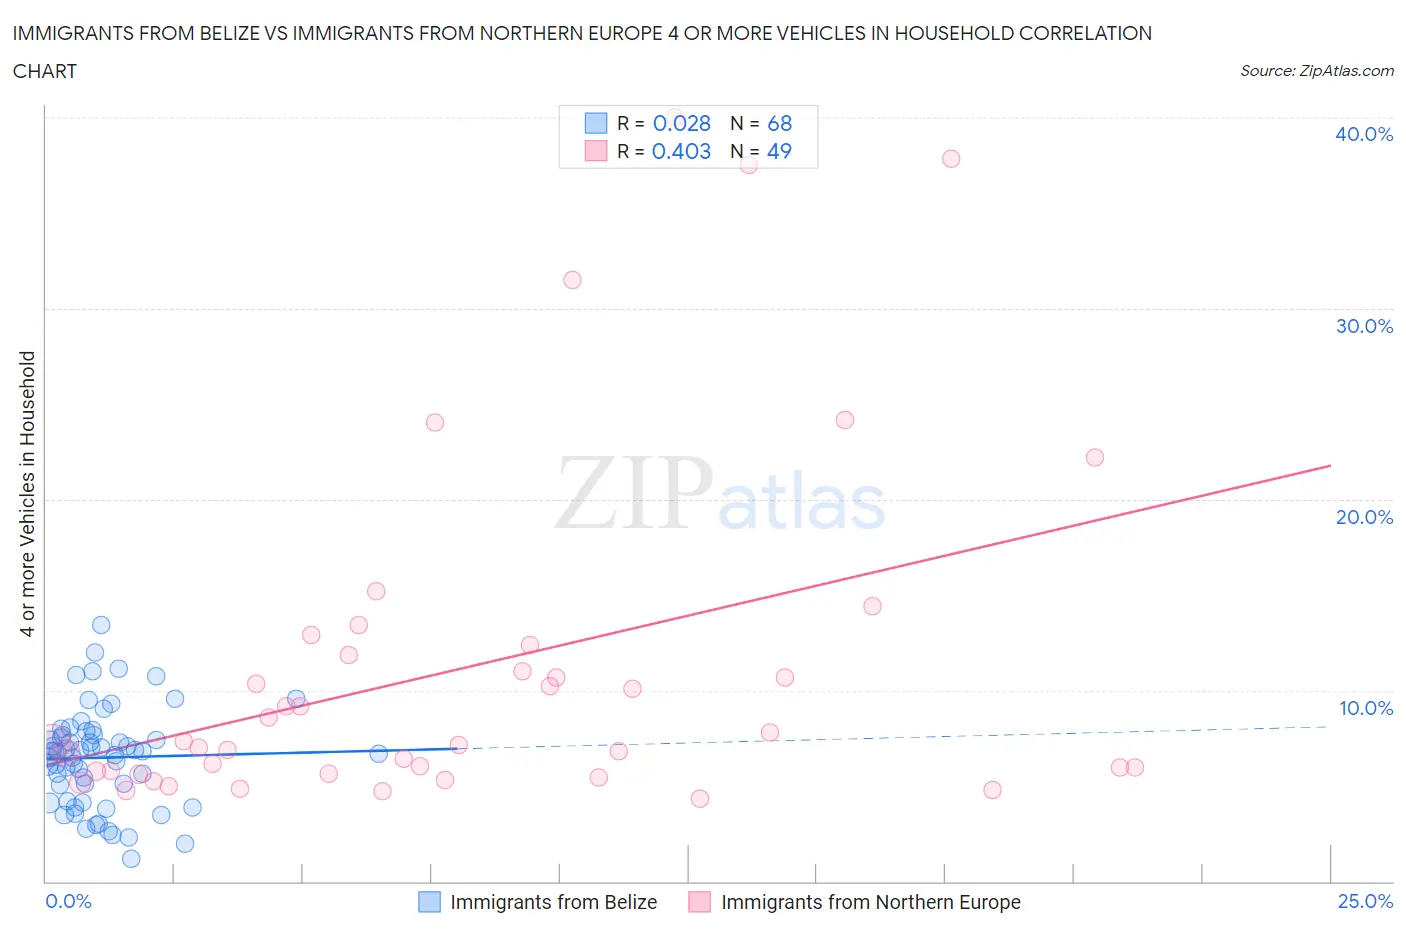
Immigrants from Belize vs Immigrants from Northern Europe 4 or more Vehicles in Household Correlation Chart
The statistical analysis conducted on geographies consisting of 129,765,587 people shows no correlation between the proportion of Immigrants from Belize and percentage of households with 4 or more vehicles available in the United States with a correlation coefficient (R) of 0.028 and weighted average of 6.1%. Similarly, the statistical analysis conducted on geographies consisting of 474,937,091 people shows a moderate positive correlation between the proportion of Immigrants from Northern Europe and percentage of households with 4 or more vehicles available in the United States with a correlation coefficient (R) of 0.403 and weighted average of 6.2%, a difference of 2.2%.
4 or more Vehicles in Household Correlation Summary
| Measurement | Immigrants from Belize | Immigrants from Northern Europe |
| Minimum | 1.2% | 4.3% |
| Maximum | 13.4% | 40.0% |
| Range | 12.3% | 35.7% |
| Mean | 6.5% | 11.2% |
| Median | 6.8% | 7.3% |
| Interquartile 25% (IQ1) | 4.6% | 5.7% |
| Interquartile 75% (IQ3) | 7.6% | 12.1% |
| Interquartile Range (IQR) | 3.0% | 6.4% |
| Standard Deviation (Sample) | 2.5% | 9.0% |
| Standard Deviation (Population) | 2.5% | 9.0% |
Demographics Similar to Immigrants from Belize and Immigrants from Northern Europe by 4 or more Vehicles in Household
In terms of 4 or more vehicles in household, the demographic groups most similar to Immigrants from Belize are Honduran (6.1%, a difference of 0.090%), Immigrants from Sierra Leone (6.1%, a difference of 0.10%), Immigrants from South Central Asia (6.1%, a difference of 0.24%), Egyptian (6.1%, a difference of 0.25%), and Latvian (6.1%, a difference of 0.30%). Similarly, the demographic groups most similar to Immigrants from Northern Europe are Thai (6.2%, a difference of 0.020%), Immigrants from South Africa (6.2%, a difference of 0.15%), Kiowa (6.2%, a difference of 0.23%), Immigrants from Eastern Asia (6.2%, a difference of 0.39%), and South African (6.2%, a difference of 0.52%).
| Demographics | Rating | Rank | 4 or more Vehicles in Household |
| Thais | 36.9 /100 | #185 | Fair 6.2% |
| Immigrants | Northern Europe | 36.8 /100 | #186 | Fair 6.2% |
| Immigrants | South Africa | 35.4 /100 | #187 | Fair 6.2% |
| Kiowa | 34.7 /100 | #188 | Fair 6.2% |
| Immigrants | Eastern Asia | 33.3 /100 | #189 | Fair 6.2% |
| South Africans | 32.2 /100 | #190 | Fair 6.2% |
| Inupiat | 30.7 /100 | #191 | Fair 6.2% |
| Romanians | 30.7 /100 | #192 | Fair 6.2% |
| Immigrants | Kuwait | 28.0 /100 | #193 | Fair 6.2% |
| Immigrants | Sweden | 27.0 /100 | #194 | Fair 6.2% |
| Argentineans | 27.0 /100 | #195 | Fair 6.2% |
| Tsimshian | 26.4 /100 | #196 | Fair 6.2% |
| Immigrants | Sri Lanka | 23.7 /100 | #197 | Fair 6.1% |
| Immigrants | Portugal | 22.3 /100 | #198 | Fair 6.1% |
| Immigrants | Norway | 21.8 /100 | #199 | Fair 6.1% |
| Latvians | 21.7 /100 | #200 | Fair 6.1% |
| Egyptians | 21.4 /100 | #201 | Fair 6.1% |
| Immigrants | South Central Asia | 21.3 /100 | #202 | Fair 6.1% |
| Immigrants | Sierra Leone | 20.5 /100 | #203 | Fair 6.1% |
| Immigrants | Belize | 19.8 /100 | #204 | Poor 6.1% |
| Hondurans | 19.3 /100 | #205 | Poor 6.1% |