Immigrants from Belgium vs Immigrants from Croatia 4 or more Vehicles in Household
COMPARE
Immigrants from Belgium
Immigrants from Croatia
4 or more Vehicles in Household
4 or more Vehicles in Household Comparison
Immigrants from Belgium
Immigrants from Croatia
5.8%
4 OR MORE VEHICLES IN HOUSEHOLD
4.0/ 100
METRIC RATING
238th/ 347
METRIC RANK
5.4%
4 OR MORE VEHICLES IN HOUSEHOLD
0.2/ 100
METRIC RATING
287th/ 347
METRIC RANK
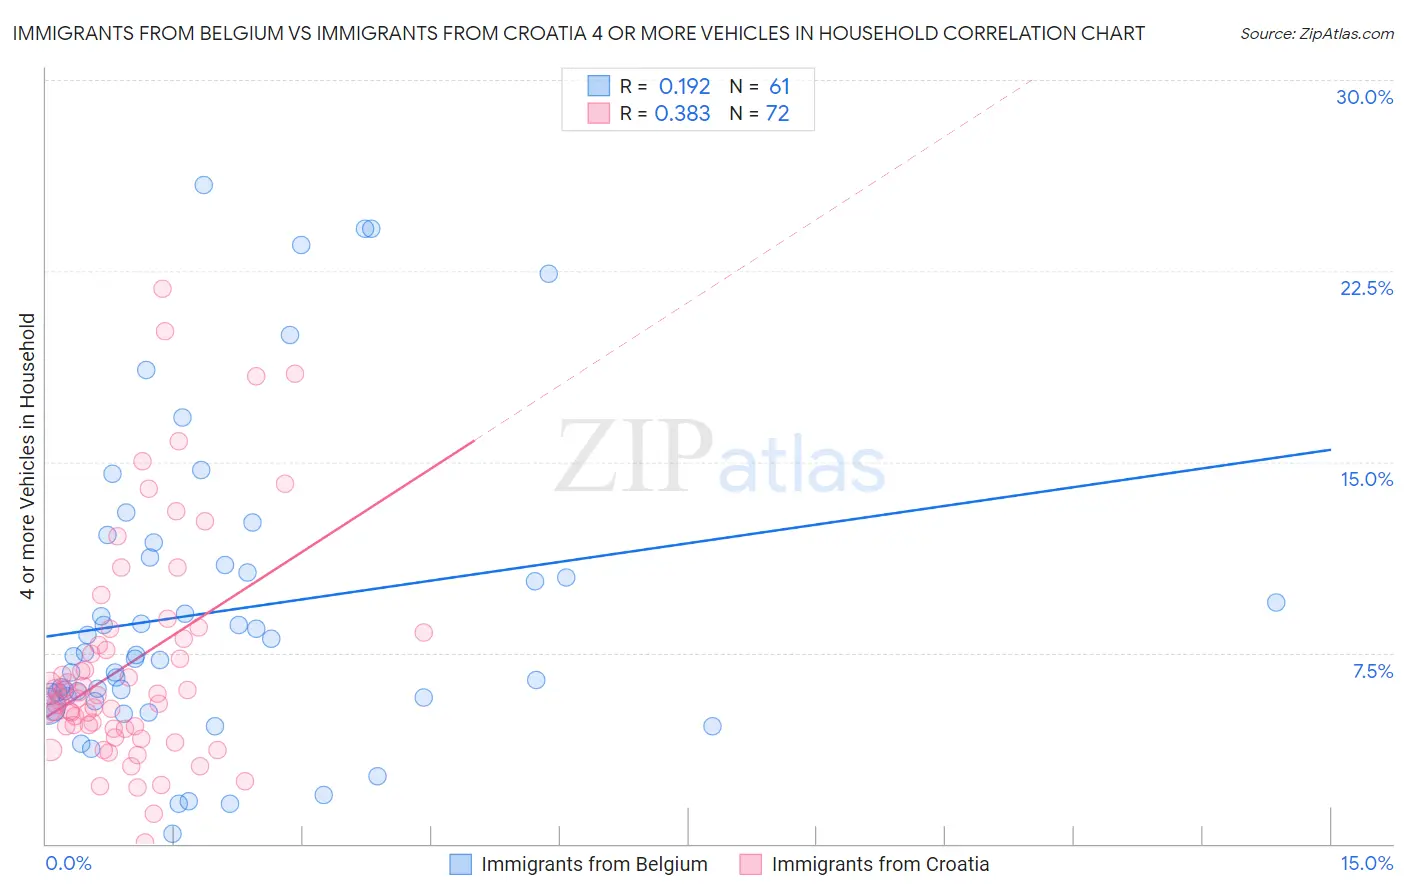
Immigrants from Belgium vs Immigrants from Croatia 4 or more Vehicles in Household Correlation Chart
The statistical analysis conducted on geographies consisting of 145,987,799 people shows a poor positive correlation between the proportion of Immigrants from Belgium and percentage of households with 4 or more vehicles available in the United States with a correlation coefficient (R) of 0.192 and weighted average of 5.8%. Similarly, the statistical analysis conducted on geographies consisting of 131,979,110 people shows a mild positive correlation between the proportion of Immigrants from Croatia and percentage of households with 4 or more vehicles available in the United States with a correlation coefficient (R) of 0.383 and weighted average of 5.4%, a difference of 8.7%.
4 or more Vehicles in Household Correlation Summary
| Measurement | Immigrants from Belgium | Immigrants from Croatia |
| Minimum | 0.41% | 0.039% |
| Maximum | 25.9% | 21.8% |
| Range | 25.5% | 21.7% |
| Mean | 9.1% | 7.1% |
| Median | 7.4% | 5.8% |
| Interquartile 25% (IQ1) | 5.7% | 4.6% |
| Interquartile 75% (IQ3) | 11.1% | 8.2% |
| Interquartile Range (IQR) | 5.4% | 3.6% |
| Standard Deviation (Sample) | 6.0% | 4.4% |
| Standard Deviation (Population) | 5.9% | 4.4% |
Similar Demographics by 4 or more Vehicles in Household
Demographics Similar to Immigrants from Belgium by 4 or more Vehicles in Household
In terms of 4 or more vehicles in household, the demographic groups most similar to Immigrants from Belgium are Immigrants from Australia (5.8%, a difference of 0.090%), Turkish (5.8%, a difference of 0.13%), Immigrants from Poland (5.8%, a difference of 0.13%), Mongolian (5.8%, a difference of 0.23%), and Immigrants from Eritrea (5.8%, a difference of 0.40%).
| Demographics | Rating | Rank | 4 or more Vehicles in Household |
| Immigrants | Switzerland | 6.4 /100 | #231 | Tragic 5.9% |
| Immigrants | Argentina | 6.0 /100 | #232 | Tragic 5.9% |
| Sierra Leoneans | 6.0 /100 | #233 | Tragic 5.9% |
| Africans | 4.6 /100 | #234 | Tragic 5.8% |
| Immigrants | Hungary | 4.6 /100 | #235 | Tragic 5.8% |
| Immigrants | Eritrea | 4.5 /100 | #236 | Tragic 5.8% |
| Turks | 4.1 /100 | #237 | Tragic 5.8% |
| Immigrants | Belgium | 4.0 /100 | #238 | Tragic 5.8% |
| Immigrants | Australia | 3.8 /100 | #239 | Tragic 5.8% |
| Immigrants | Poland | 3.8 /100 | #240 | Tragic 5.8% |
| Mongolians | 3.7 /100 | #241 | Tragic 5.8% |
| Immigrants | Middle Africa | 3.4 /100 | #242 | Tragic 5.8% |
| Immigrants | Czechoslovakia | 3.2 /100 | #243 | Tragic 5.8% |
| Ethiopians | 3.2 /100 | #244 | Tragic 5.8% |
| Bulgarians | 3.1 /100 | #245 | Tragic 5.8% |
Demographics Similar to Immigrants from Croatia by 4 or more Vehicles in Household
In terms of 4 or more vehicles in household, the demographic groups most similar to Immigrants from Croatia are Immigrants from Colombia (5.4%, a difference of 0.10%), Immigrants from Liberia (5.4%, a difference of 0.13%), Venezuelan (5.3%, a difference of 0.19%), Immigrants from Bosnia and Herzegovina (5.3%, a difference of 0.33%), and Brazilian (5.4%, a difference of 0.47%).
| Demographics | Rating | Rank | 4 or more Vehicles in Household |
| Alsatians | 0.3 /100 | #280 | Tragic 5.4% |
| Immigrants | Western Africa | 0.3 /100 | #281 | Tragic 5.4% |
| Immigrants | Spain | 0.3 /100 | #282 | Tragic 5.4% |
| Immigrants | Ireland | 0.3 /100 | #283 | Tragic 5.4% |
| Brazilians | 0.3 /100 | #284 | Tragic 5.4% |
| Immigrants | Liberia | 0.2 /100 | #285 | Tragic 5.4% |
| Immigrants | Colombia | 0.2 /100 | #286 | Tragic 5.4% |
| Immigrants | Croatia | 0.2 /100 | #287 | Tragic 5.4% |
| Venezuelans | 0.2 /100 | #288 | Tragic 5.3% |
| Immigrants | Bosnia and Herzegovina | 0.2 /100 | #289 | Tragic 5.3% |
| Immigrants | Russia | 0.2 /100 | #290 | Tragic 5.3% |
| Immigrants | Bahamas | 0.1 /100 | #291 | Tragic 5.3% |
| Liberians | 0.1 /100 | #292 | Tragic 5.3% |
| Immigrants | Congo | 0.1 /100 | #293 | Tragic 5.2% |
| Ghanaians | 0.1 /100 | #294 | Tragic 5.2% |