Chinese vs Immigrants from Croatia 4 or more Vehicles in Household
COMPARE
Chinese
Immigrants from Croatia
4 or more Vehicles in Household
4 or more Vehicles in Household Comparison
Chinese
Immigrants from Croatia
8.8%
4 OR MORE VEHICLES IN HOUSEHOLD
100.0/ 100
METRIC RATING
14th/ 347
METRIC RANK
5.4%
4 OR MORE VEHICLES IN HOUSEHOLD
0.2/ 100
METRIC RATING
287th/ 347
METRIC RANK
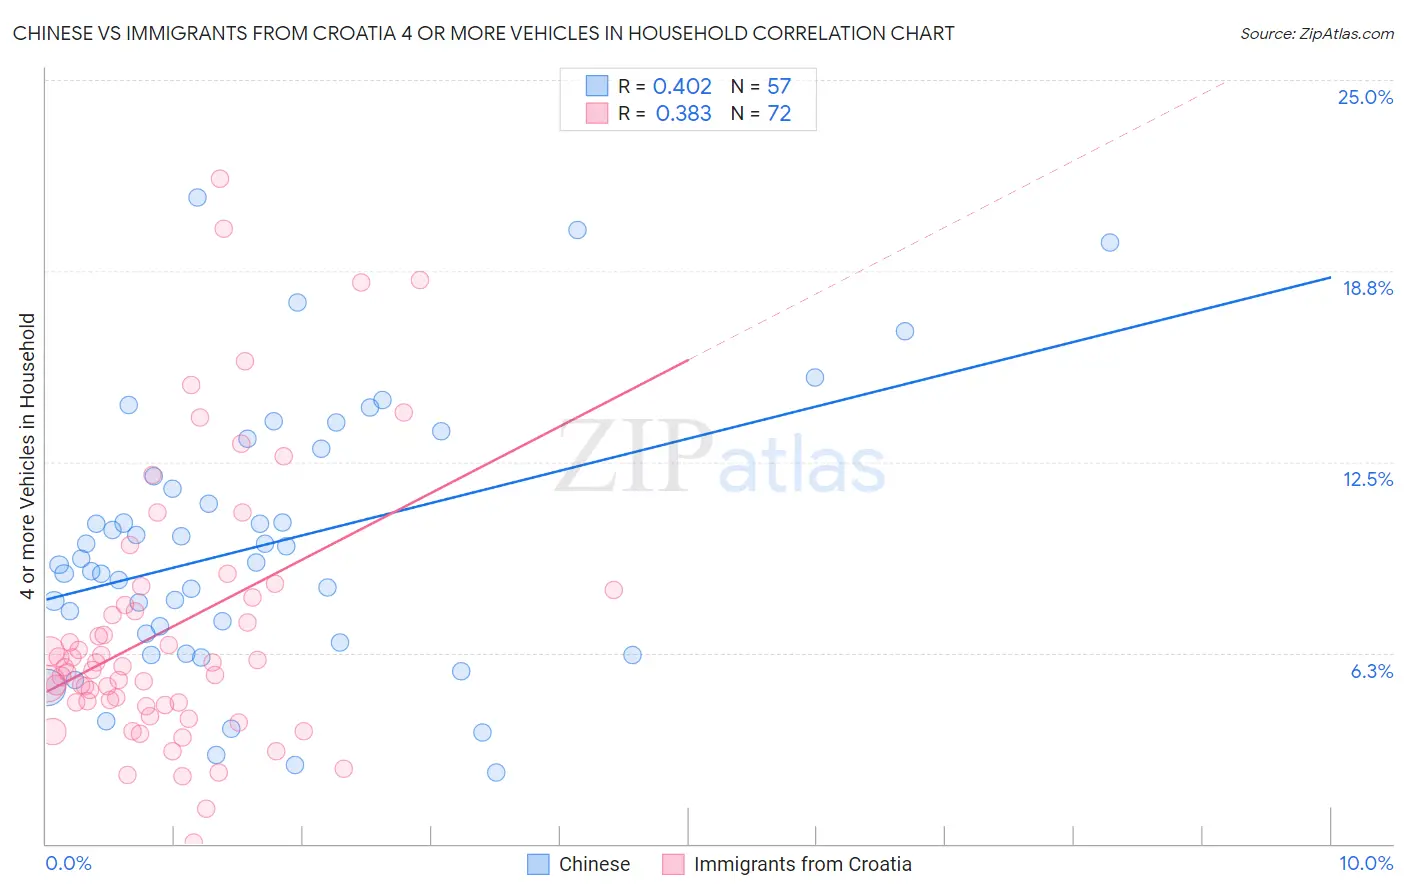
Chinese vs Immigrants from Croatia 4 or more Vehicles in Household Correlation Chart
The statistical analysis conducted on geographies consisting of 64,794,143 people shows a moderate positive correlation between the proportion of Chinese and percentage of households with 4 or more vehicles available in the United States with a correlation coefficient (R) of 0.402 and weighted average of 8.8%. Similarly, the statistical analysis conducted on geographies consisting of 131,979,110 people shows a mild positive correlation between the proportion of Immigrants from Croatia and percentage of households with 4 or more vehicles available in the United States with a correlation coefficient (R) of 0.383 and weighted average of 5.4%, a difference of 65.4%.
4 or more Vehicles in Household Correlation Summary
| Measurement | Chinese | Immigrants from Croatia |
| Minimum | 2.3% | 0.039% |
| Maximum | 21.2% | 21.8% |
| Range | 18.9% | 21.7% |
| Mean | 9.8% | 7.1% |
| Median | 9.2% | 5.8% |
| Interquartile 25% (IQ1) | 6.7% | 4.6% |
| Interquartile 75% (IQ3) | 12.5% | 8.2% |
| Interquartile Range (IQR) | 5.8% | 3.6% |
| Standard Deviation (Sample) | 4.3% | 4.4% |
| Standard Deviation (Population) | 4.3% | 4.4% |
Similar Demographics by 4 or more Vehicles in Household
Demographics Similar to Chinese by 4 or more Vehicles in Household
In terms of 4 or more vehicles in household, the demographic groups most similar to Chinese are Shoshone (8.8%, a difference of 0.030%), Lumbee (8.8%, a difference of 0.74%), Hawaiian (8.9%, a difference of 1.0%), Mexican (8.9%, a difference of 1.0%), and Ute (8.8%, a difference of 1.1%).
| Demographics | Rating | Rank | 4 or more Vehicles in Household |
| Native Hawaiians | 100.0 /100 | #7 | Exceptional 9.4% |
| Arapaho | 100.0 /100 | #8 | Exceptional 9.4% |
| Samoans | 100.0 /100 | #9 | Exceptional 9.2% |
| Paiute | 100.0 /100 | #10 | Exceptional 9.0% |
| Immigrants | Mexico | 100.0 /100 | #11 | Exceptional 9.0% |
| Mexicans | 100.0 /100 | #12 | Exceptional 8.9% |
| Hawaiians | 100.0 /100 | #13 | Exceptional 8.9% |
| Chinese | 100.0 /100 | #14 | Exceptional 8.8% |
| Shoshone | 100.0 /100 | #15 | Exceptional 8.8% |
| Lumbee | 100.0 /100 | #16 | Exceptional 8.8% |
| Ute | 100.0 /100 | #17 | Exceptional 8.8% |
| Nepalese | 100.0 /100 | #18 | Exceptional 8.7% |
| Koreans | 100.0 /100 | #19 | Exceptional 8.6% |
| Pueblo | 100.0 /100 | #20 | Exceptional 8.6% |
| Danes | 100.0 /100 | #21 | Exceptional 8.6% |
Demographics Similar to Immigrants from Croatia by 4 or more Vehicles in Household
In terms of 4 or more vehicles in household, the demographic groups most similar to Immigrants from Croatia are Immigrants from Colombia (5.4%, a difference of 0.10%), Immigrants from Liberia (5.4%, a difference of 0.13%), Venezuelan (5.3%, a difference of 0.19%), Immigrants from Bosnia and Herzegovina (5.3%, a difference of 0.33%), and Brazilian (5.4%, a difference of 0.47%).
| Demographics | Rating | Rank | 4 or more Vehicles in Household |
| Alsatians | 0.3 /100 | #280 | Tragic 5.4% |
| Immigrants | Western Africa | 0.3 /100 | #281 | Tragic 5.4% |
| Immigrants | Spain | 0.3 /100 | #282 | Tragic 5.4% |
| Immigrants | Ireland | 0.3 /100 | #283 | Tragic 5.4% |
| Brazilians | 0.3 /100 | #284 | Tragic 5.4% |
| Immigrants | Liberia | 0.2 /100 | #285 | Tragic 5.4% |
| Immigrants | Colombia | 0.2 /100 | #286 | Tragic 5.4% |
| Immigrants | Croatia | 0.2 /100 | #287 | Tragic 5.4% |
| Venezuelans | 0.2 /100 | #288 | Tragic 5.3% |
| Immigrants | Bosnia and Herzegovina | 0.2 /100 | #289 | Tragic 5.3% |
| Immigrants | Russia | 0.2 /100 | #290 | Tragic 5.3% |
| Immigrants | Bahamas | 0.1 /100 | #291 | Tragic 5.3% |
| Liberians | 0.1 /100 | #292 | Tragic 5.3% |
| Immigrants | Congo | 0.1 /100 | #293 | Tragic 5.2% |
| Ghanaians | 0.1 /100 | #294 | Tragic 5.2% |