Immigrants from Belgium vs Immigrants from Asia Child Poverty Under the Age of 16
COMPARE
Immigrants from Belgium
Immigrants from Asia
Child Poverty Under the Age of 16
Child Poverty Under the Age of 16 Comparison
Immigrants from Belgium
Immigrants from Asia
14.1%
CHILD POVERTY UNDER THE AGE OF 16
98.6/ 100
METRIC RATING
57th/ 347
METRIC RANK
13.8%
CHILD POVERTY UNDER THE AGE OF 16
99.2/ 100
METRIC RATING
46th/ 347
METRIC RANK
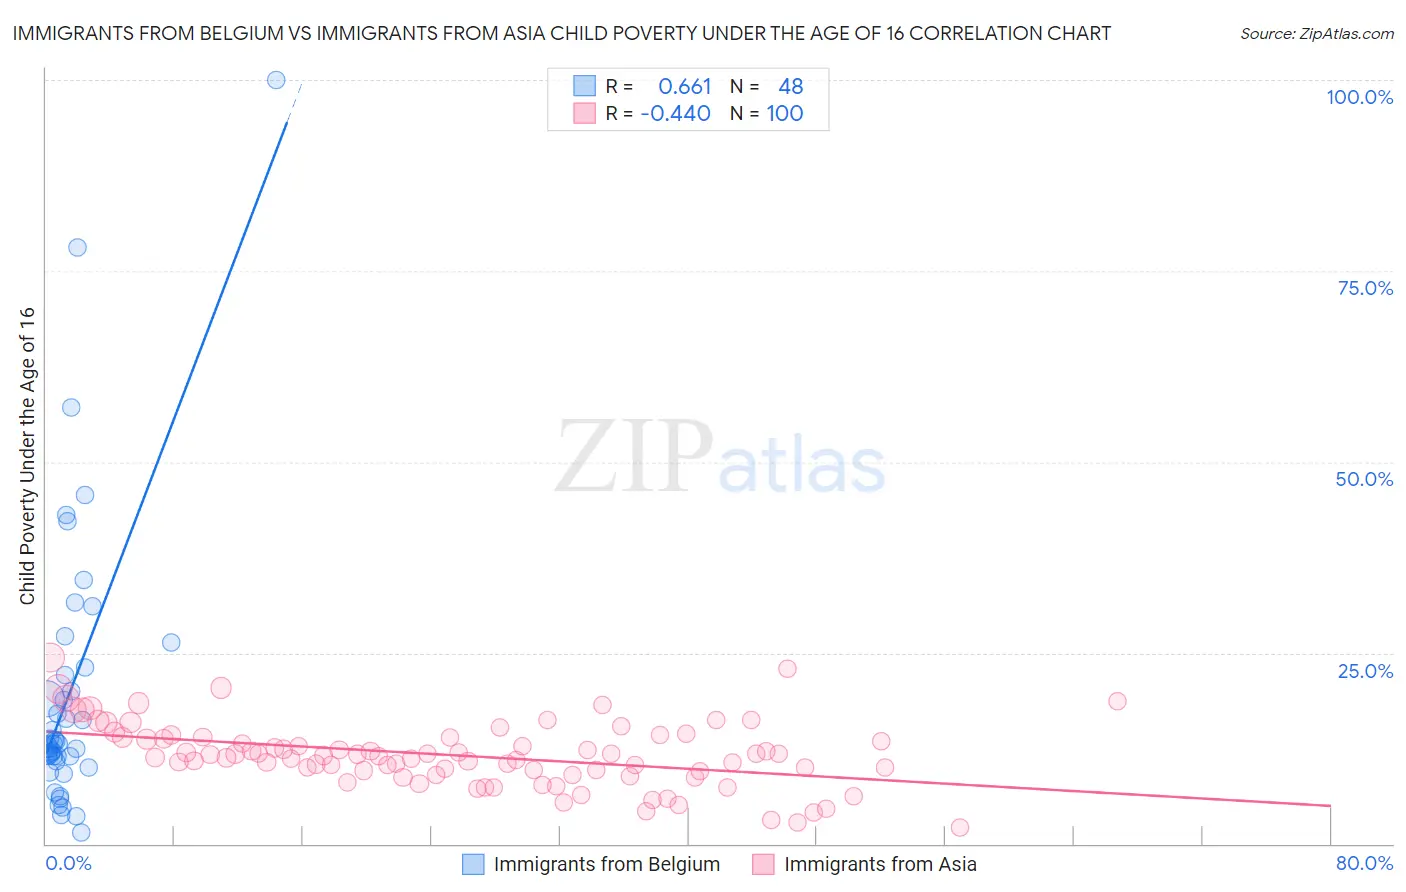
Immigrants from Belgium vs Immigrants from Asia Child Poverty Under the Age of 16 Correlation Chart
The statistical analysis conducted on geographies consisting of 145,943,045 people shows a significant positive correlation between the proportion of Immigrants from Belgium and poverty level among children under the age of 16 in the United States with a correlation coefficient (R) of 0.661 and weighted average of 14.1%. Similarly, the statistical analysis conducted on geographies consisting of 538,871,669 people shows a moderate negative correlation between the proportion of Immigrants from Asia and poverty level among children under the age of 16 in the United States with a correlation coefficient (R) of -0.440 and weighted average of 13.8%, a difference of 2.0%.
Child Poverty Under the Age of 16 Correlation Summary
| Measurement | Immigrants from Belgium | Immigrants from Asia |
| Minimum | 1.6% | 2.1% |
| Maximum | 100.0% | 24.4% |
| Range | 98.4% | 22.3% |
| Mean | 20.0% | 11.6% |
| Median | 13.1% | 11.5% |
| Interquartile 25% (IQ1) | 11.1% | 9.3% |
| Interquartile 75% (IQ3) | 22.5% | 14.0% |
| Interquartile Range (IQR) | 11.5% | 4.6% |
| Standard Deviation (Sample) | 18.9% | 4.2% |
| Standard Deviation (Population) | 18.7% | 4.2% |
Demographics Similar to Immigrants from Belgium and Immigrants from Asia by Child Poverty Under the Age of 16
In terms of child poverty under the age of 16, the demographic groups most similar to Immigrants from Belgium are Immigrants from Pakistan (14.1%, a difference of 0.020%), Scandinavian (14.1%, a difference of 0.030%), Immigrants from Serbia (14.1%, a difference of 0.090%), Immigrants from Austria (14.2%, a difference of 0.22%), and Immigrants from Indonesia (14.1%, a difference of 0.26%). Similarly, the demographic groups most similar to Immigrants from Asia are Estonian (13.9%, a difference of 0.16%), Korean (13.9%, a difference of 0.22%), Italian (13.9%, a difference of 0.25%), Czech (13.8%, a difference of 0.29%), and Greek (13.8%, a difference of 0.34%).
| Demographics | Rating | Rank | Child Poverty Under the Age of 16 |
| Croatians | 99.4 /100 | #41 | Exceptional 13.8% |
| Immigrants | Sri Lanka | 99.3 /100 | #42 | Exceptional 13.8% |
| Immigrants | Moldova | 99.3 /100 | #43 | Exceptional 13.8% |
| Greeks | 99.3 /100 | #44 | Exceptional 13.8% |
| Czechs | 99.3 /100 | #45 | Exceptional 13.8% |
| Immigrants | Asia | 99.2 /100 | #46 | Exceptional 13.8% |
| Estonians | 99.2 /100 | #47 | Exceptional 13.9% |
| Koreans | 99.2 /100 | #48 | Exceptional 13.9% |
| Italians | 99.2 /100 | #49 | Exceptional 13.9% |
| Immigrants | Czechoslovakia | 99.1 /100 | #50 | Exceptional 13.9% |
| Immigrants | Greece | 99.1 /100 | #51 | Exceptional 13.9% |
| Poles | 98.9 /100 | #52 | Exceptional 14.0% |
| Immigrants | Israel | 98.8 /100 | #53 | Exceptional 14.1% |
| Tsimshian | 98.8 /100 | #54 | Exceptional 14.1% |
| Immigrants | Indonesia | 98.7 /100 | #55 | Exceptional 14.1% |
| Immigrants | Serbia | 98.7 /100 | #56 | Exceptional 14.1% |
| Immigrants | Belgium | 98.6 /100 | #57 | Exceptional 14.1% |
| Immigrants | Pakistan | 98.6 /100 | #58 | Exceptional 14.1% |
| Scandinavians | 98.6 /100 | #59 | Exceptional 14.1% |
| Immigrants | Austria | 98.5 /100 | #60 | Exceptional 14.2% |
| Immigrants | Sweden | 98.5 /100 | #61 | Exceptional 14.2% |