Pennsylvania German vs Fijian 2 or more Vehicles in Household
COMPARE
Pennsylvania German
Fijian
2 or more Vehicles in Household
2 or more Vehicles in Household Comparison
Pennsylvania Germans
Fijians
58.5%
2 OR MORE VEHICLES IN HOUSEHOLD
99.7/ 100
METRIC RATING
69th/ 347
METRIC RANK
57.6%
2 OR MORE VEHICLES IN HOUSEHOLD
98.4/ 100
METRIC RATING
100th/ 347
METRIC RANK
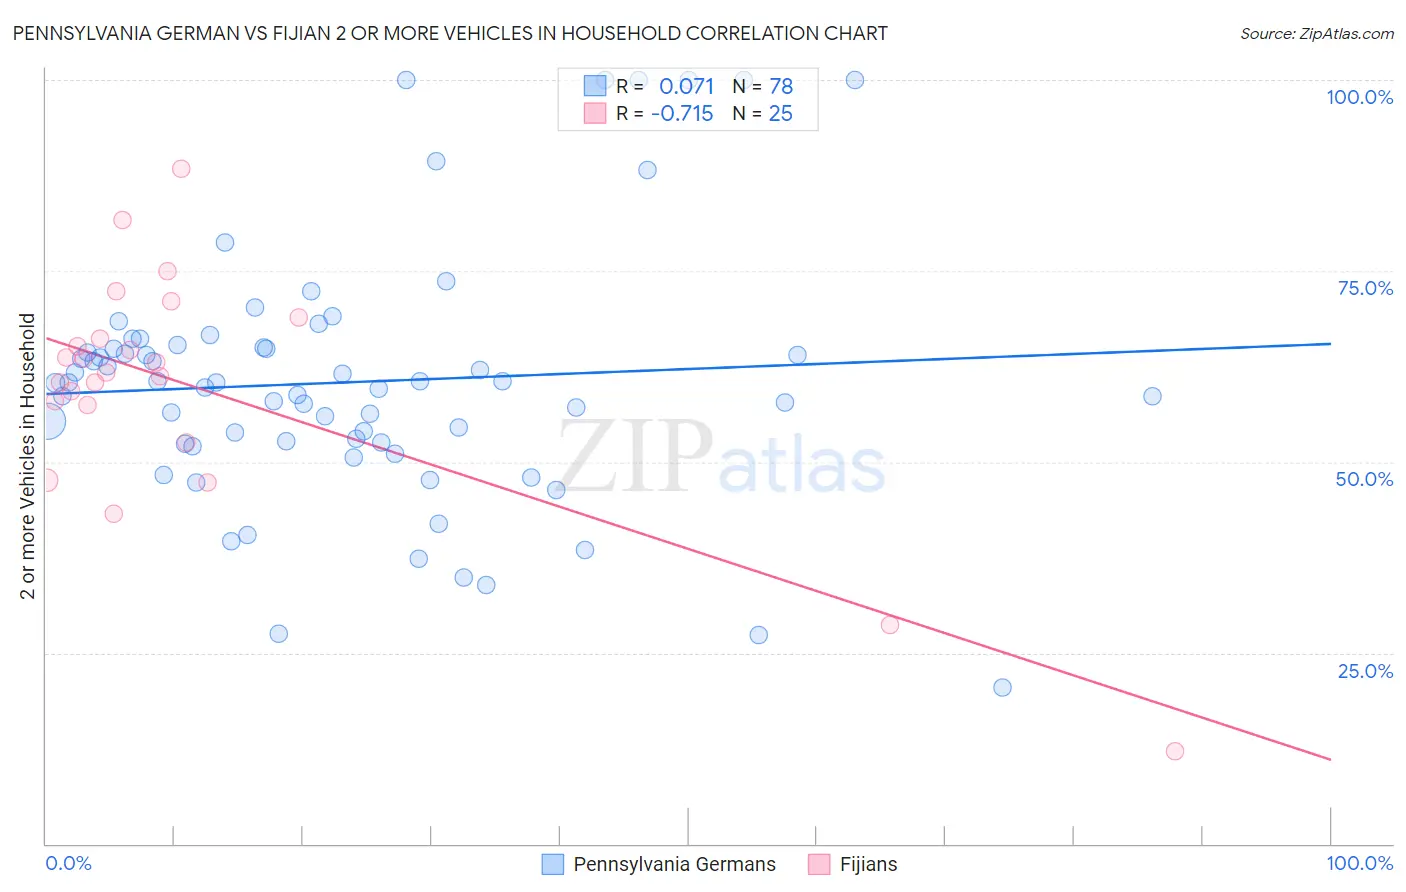
Pennsylvania German vs Fijian 2 or more Vehicles in Household Correlation Chart
The statistical analysis conducted on geographies consisting of 234,072,378 people shows a slight positive correlation between the proportion of Pennsylvania Germans and percentage of households with 2 or more vehicles available in the United States with a correlation coefficient (R) of 0.071 and weighted average of 58.5%. Similarly, the statistical analysis conducted on geographies consisting of 55,948,040 people shows a strong negative correlation between the proportion of Fijians and percentage of households with 2 or more vehicles available in the United States with a correlation coefficient (R) of -0.715 and weighted average of 57.6%, a difference of 1.5%.
2 or more Vehicles in Household Correlation Summary
| Measurement | Pennsylvania German | Fijian |
| Minimum | 20.5% | 12.2% |
| Maximum | 100.0% | 88.4% |
| Range | 79.5% | 76.3% |
| Mean | 60.4% | 59.7% |
| Median | 60.3% | 61.6% |
| Interquartile 25% (IQ1) | 52.6% | 54.9% |
| Interquartile 75% (IQ3) | 65.0% | 67.6% |
| Interquartile Range (IQR) | 12.4% | 12.6% |
| Standard Deviation (Sample) | 16.6% | 15.7% |
| Standard Deviation (Population) | 16.5% | 15.4% |
Similar Demographics by 2 or more Vehicles in Household
Demographics Similar to Pennsylvania Germans by 2 or more Vehicles in Household
In terms of 2 or more vehicles in household, the demographic groups most similar to Pennsylvania Germans are Italian (58.4%, a difference of 0.11%), Canadian (58.6%, a difference of 0.12%), Laotian (58.6%, a difference of 0.13%), Bangladeshi (58.4%, a difference of 0.14%), and Croatian (58.6%, a difference of 0.15%).
| Demographics | Rating | Rank | 2 or more Vehicles in Household |
| Immigrants | Nonimmigrants | 99.8 /100 | #62 | Exceptional 58.8% |
| Mexican American Indians | 99.8 /100 | #63 | Exceptional 58.7% |
| Portuguese | 99.7 /100 | #64 | Exceptional 58.6% |
| Immigrants | Central America | 99.7 /100 | #65 | Exceptional 58.6% |
| Croatians | 99.7 /100 | #66 | Exceptional 58.6% |
| Laotians | 99.7 /100 | #67 | Exceptional 58.6% |
| Canadians | 99.7 /100 | #68 | Exceptional 58.6% |
| Pennsylvania Germans | 99.7 /100 | #69 | Exceptional 58.5% |
| Italians | 99.6 /100 | #70 | Exceptional 58.4% |
| Bangladeshis | 99.6 /100 | #71 | Exceptional 58.4% |
| Austrians | 99.6 /100 | #72 | Exceptional 58.4% |
| Bolivians | 99.6 /100 | #73 | Exceptional 58.3% |
| Immigrants | Afghanistan | 99.6 /100 | #74 | Exceptional 58.3% |
| Poles | 99.5 /100 | #75 | Exceptional 58.3% |
| Creek | 99.5 /100 | #76 | Exceptional 58.3% |
Demographics Similar to Fijians by 2 or more Vehicles in Household
In terms of 2 or more vehicles in household, the demographic groups most similar to Fijians are Lebanese (57.6%, a difference of 0.050%), Cajun (57.7%, a difference of 0.070%), Immigrants from Bolivia (57.6%, a difference of 0.090%), Jordanian (57.6%, a difference of 0.10%), and Immigrants from Indonesia (57.6%, a difference of 0.10%).
| Demographics | Rating | Rank | 2 or more Vehicles in Household |
| Ottawa | 99.0 /100 | #93 | Exceptional 57.9% |
| Filipinos | 98.9 /100 | #94 | Exceptional 57.8% |
| Hmong | 98.9 /100 | #95 | Exceptional 57.8% |
| Burmese | 98.8 /100 | #96 | Exceptional 57.8% |
| Slavs | 98.8 /100 | #97 | Exceptional 57.8% |
| Palestinians | 98.6 /100 | #98 | Exceptional 57.7% |
| Cajuns | 98.5 /100 | #99 | Exceptional 57.7% |
| Fijians | 98.4 /100 | #100 | Exceptional 57.6% |
| Lebanese | 98.3 /100 | #101 | Exceptional 57.6% |
| Immigrants | Bolivia | 98.2 /100 | #102 | Exceptional 57.6% |
| Jordanians | 98.2 /100 | #103 | Exceptional 57.6% |
| Immigrants | Indonesia | 98.2 /100 | #104 | Exceptional 57.6% |
| Immigrants | Korea | 98.2 /100 | #105 | Exceptional 57.6% |
| Immigrants | Oceania | 98.2 /100 | #106 | Exceptional 57.5% |
| Immigrants | Netherlands | 98.2 /100 | #107 | Exceptional 57.5% |