Mongolian vs Immigrants from Italy 1 or more Vehicles in Household
COMPARE
Mongolian
Immigrants from Italy
1 or more Vehicles in Household
1 or more Vehicles in Household Comparison
Mongolians
Immigrants from Italy
87.0%
1 OR MORE VEHICLES IN HOUSEHOLD
0.0/ 100
METRIC RATING
281st/ 347
METRIC RANK
89.1%
1 OR MORE VEHICLES IN HOUSEHOLD
14.0/ 100
METRIC RATING
209th/ 347
METRIC RANK
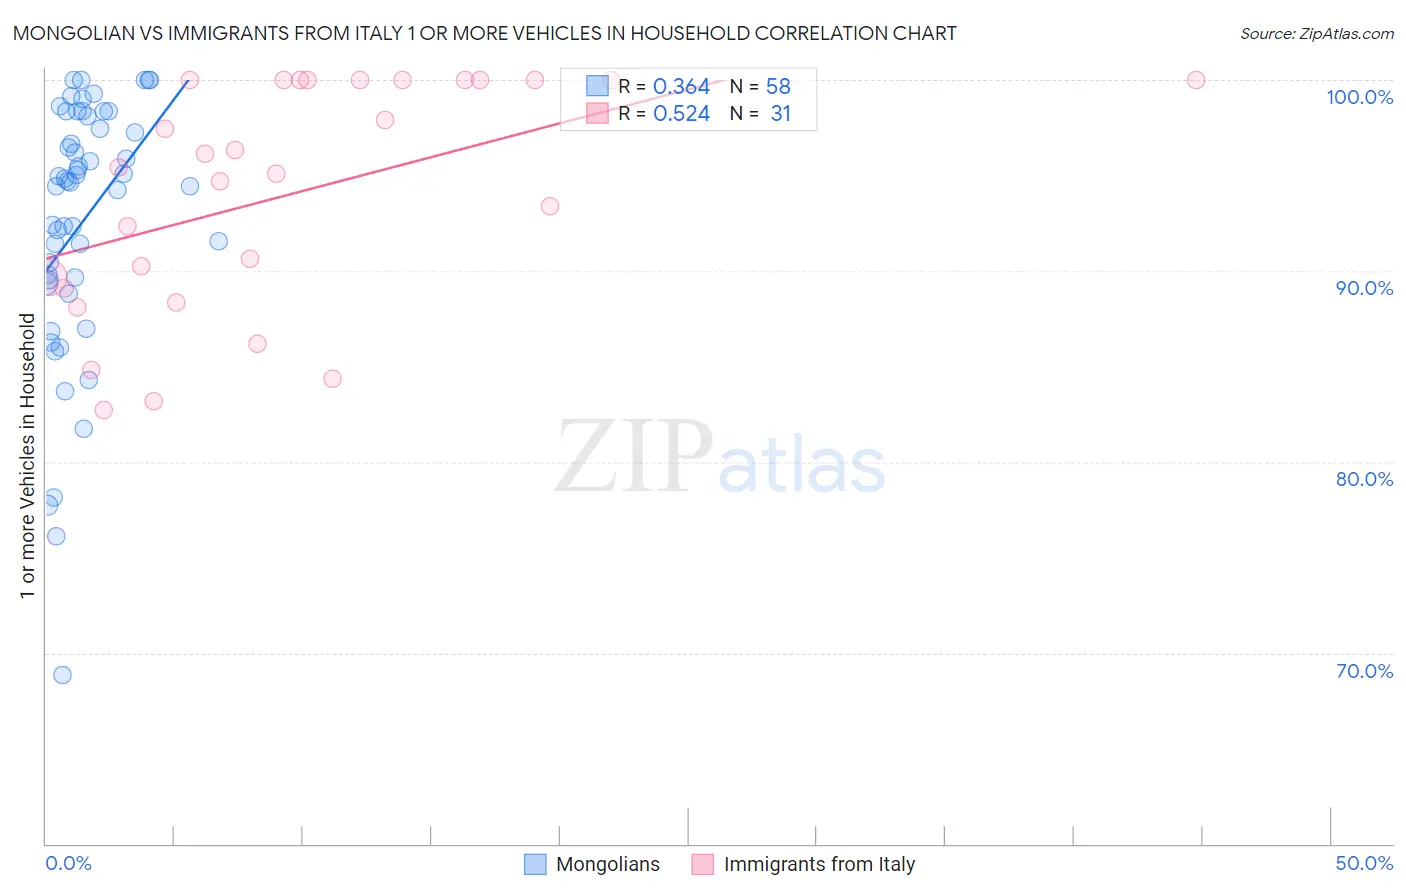
Mongolian vs Immigrants from Italy 1 or more Vehicles in Household Correlation Chart
The statistical analysis conducted on geographies consisting of 140,176,126 people shows a mild positive correlation between the proportion of Mongolians and percentage of households with 1 or more vehicles available in the United States with a correlation coefficient (R) of 0.364 and weighted average of 87.0%. Similarly, the statistical analysis conducted on geographies consisting of 324,164,676 people shows a substantial positive correlation between the proportion of Immigrants from Italy and percentage of households with 1 or more vehicles available in the United States with a correlation coefficient (R) of 0.524 and weighted average of 89.1%, a difference of 2.4%.
1 or more Vehicles in Household Correlation Summary
| Measurement | Mongolian | Immigrants from Italy |
| Minimum | 68.8% | 82.7% |
| Maximum | 100.0% | 100.0% |
| Range | 31.2% | 17.3% |
| Mean | 92.6% | 94.1% |
| Median | 94.6% | 95.4% |
| Interquartile 25% (IQ1) | 89.5% | 89.1% |
| Interquartile 75% (IQ3) | 98.1% | 100.0% |
| Interquartile Range (IQR) | 8.6% | 10.9% |
| Standard Deviation (Sample) | 6.7% | 5.9% |
| Standard Deviation (Population) | 6.7% | 5.8% |
Similar Demographics by 1 or more Vehicles in Household
Demographics Similar to Mongolians by 1 or more Vehicles in Household
In terms of 1 or more vehicles in household, the demographic groups most similar to Mongolians are Immigrants from Croatia (87.0%, a difference of 0.060%), Immigrants from Albania (87.1%, a difference of 0.090%), Immigrants from Southern Europe (87.1%, a difference of 0.10%), Alsatian (87.1%, a difference of 0.14%), and Immigrants from France (87.1%, a difference of 0.20%).
| Demographics | Rating | Rank | 1 or more Vehicles in Household |
| Immigrants | Morocco | 0.1 /100 | #274 | Tragic 87.4% |
| Immigrants | Singapore | 0.1 /100 | #275 | Tragic 87.2% |
| Immigrants | France | 0.1 /100 | #276 | Tragic 87.1% |
| Alsatians | 0.1 /100 | #277 | Tragic 87.1% |
| Immigrants | Southern Europe | 0.1 /100 | #278 | Tragic 87.1% |
| Immigrants | Albania | 0.1 /100 | #279 | Tragic 87.1% |
| Immigrants | Croatia | 0.0 /100 | #280 | Tragic 87.0% |
| Mongolians | 0.0 /100 | #281 | Tragic 87.0% |
| Colville | 0.0 /100 | #282 | Tragic 86.8% |
| Immigrants | Eastern Europe | 0.0 /100 | #283 | Tragic 86.7% |
| Central American Indians | 0.0 /100 | #284 | Tragic 86.7% |
| Immigrants | Kazakhstan | 0.0 /100 | #285 | Tragic 86.6% |
| Immigrants | Eastern Asia | 0.0 /100 | #286 | Tragic 86.5% |
| Immigrants | Malaysia | 0.0 /100 | #287 | Tragic 86.5% |
| Hopi | 0.0 /100 | #288 | Tragic 86.4% |
Demographics Similar to Immigrants from Italy by 1 or more Vehicles in Household
In terms of 1 or more vehicles in household, the demographic groups most similar to Immigrants from Italy are Immigrants from Chile (89.1%, a difference of 0.010%), Dutch West Indian (89.0%, a difference of 0.020%), Immigrants from Denmark (89.1%, a difference of 0.030%), Sierra Leonean (89.0%, a difference of 0.030%), and Somali (89.0%, a difference of 0.040%).
| Demographics | Rating | Rank | 1 or more Vehicles in Household |
| Iroquois | 19.8 /100 | #202 | Poor 89.2% |
| Cambodians | 18.9 /100 | #203 | Poor 89.2% |
| Romanians | 18.2 /100 | #204 | Poor 89.2% |
| Guatemalans | 17.8 /100 | #205 | Poor 89.2% |
| Apache | 16.2 /100 | #206 | Poor 89.1% |
| Immigrants | Denmark | 14.8 /100 | #207 | Poor 89.1% |
| Immigrants | Chile | 14.4 /100 | #208 | Poor 89.1% |
| Immigrants | Italy | 14.0 /100 | #209 | Poor 89.1% |
| Dutch West Indians | 13.5 /100 | #210 | Poor 89.0% |
| Sierra Leoneans | 13.0 /100 | #211 | Poor 89.0% |
| Somalis | 12.8 /100 | #212 | Poor 89.0% |
| Immigrants | Western Asia | 12.3 /100 | #213 | Poor 89.0% |
| Immigrants | Hungary | 11.9 /100 | #214 | Poor 89.0% |
| Immigrants | Sri Lanka | 10.2 /100 | #215 | Poor 88.9% |
| Immigrants | Argentina | 9.4 /100 | #216 | Tragic 88.9% |