Subsaharan African vs British West Indian 1 or more Vehicles in Household
COMPARE
Subsaharan African
British West Indian
1 or more Vehicles in Household
1 or more Vehicles in Household Comparison
Sub-Saharan Africans
British West Indians
87.9%
1 OR MORE VEHICLES IN HOUSEHOLD
0.5/ 100
METRIC RATING
262nd/ 347
METRIC RANK
70.4%
1 OR MORE VEHICLES IN HOUSEHOLD
0.0/ 100
METRIC RATING
343rd/ 347
METRIC RANK
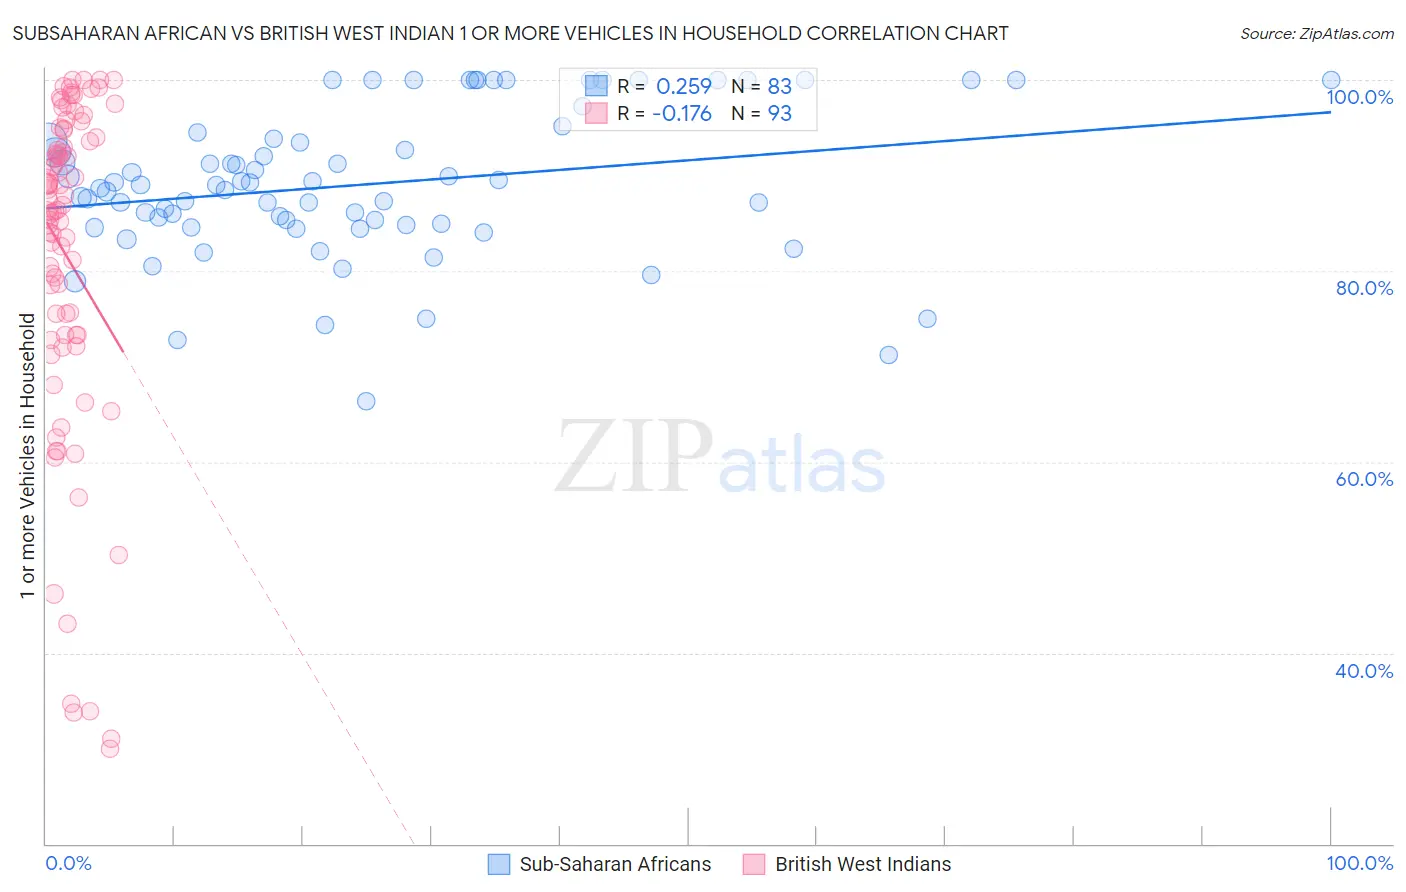
Subsaharan African vs British West Indian 1 or more Vehicles in Household Correlation Chart
The statistical analysis conducted on geographies consisting of 507,682,612 people shows a weak positive correlation between the proportion of Sub-Saharan Africans and percentage of households with 1 or more vehicles available in the United States with a correlation coefficient (R) of 0.259 and weighted average of 87.9%. Similarly, the statistical analysis conducted on geographies consisting of 152,639,821 people shows a poor negative correlation between the proportion of British West Indians and percentage of households with 1 or more vehicles available in the United States with a correlation coefficient (R) of -0.176 and weighted average of 70.4%, a difference of 24.9%.
1 or more Vehicles in Household Correlation Summary
| Measurement | Subsaharan African | British West Indian |
| Minimum | 66.4% | 30.0% |
| Maximum | 100.0% | 100.0% |
| Range | 33.6% | 70.0% |
| Mean | 89.1% | 81.5% |
| Median | 89.0% | 86.4% |
| Interquartile 25% (IQ1) | 84.8% | 73.2% |
| Interquartile 75% (IQ3) | 93.8% | 94.3% |
| Interquartile Range (IQR) | 9.0% | 21.1% |
| Standard Deviation (Sample) | 7.7% | 17.6% |
| Standard Deviation (Population) | 7.6% | 17.5% |
Similar Demographics by 1 or more Vehicles in Household
Demographics Similar to Sub-Saharan Africans by 1 or more Vehicles in Household
In terms of 1 or more vehicles in household, the demographic groups most similar to Sub-Saharan Africans are Immigrants from Switzerland (87.9%, a difference of 0.030%), Macedonian (87.9%, a difference of 0.070%), Immigrants from Egypt (87.8%, a difference of 0.070%), Immigrants from Liberia (87.8%, a difference of 0.080%), and African (87.8%, a difference of 0.11%).
| Demographics | Rating | Rank | 1 or more Vehicles in Household |
| Immigrants | Latvia | 0.9 /100 | #255 | Tragic 88.1% |
| Colombians | 0.9 /100 | #256 | Tragic 88.0% |
| Liberians | 0.9 /100 | #257 | Tragic 88.0% |
| South American Indians | 0.9 /100 | #258 | Tragic 88.0% |
| Nigerians | 0.8 /100 | #259 | Tragic 88.0% |
| Macedonians | 0.6 /100 | #260 | Tragic 87.9% |
| Immigrants | Switzerland | 0.6 /100 | #261 | Tragic 87.9% |
| Sub-Saharan Africans | 0.5 /100 | #262 | Tragic 87.9% |
| Immigrants | Egypt | 0.5 /100 | #263 | Tragic 87.8% |
| Immigrants | Liberia | 0.4 /100 | #264 | Tragic 87.8% |
| Africans | 0.4 /100 | #265 | Tragic 87.8% |
| Israelis | 0.3 /100 | #266 | Tragic 87.7% |
| Immigrants | Colombia | 0.3 /100 | #267 | Tragic 87.6% |
| Immigrants | Europe | 0.2 /100 | #268 | Tragic 87.6% |
| Immigrants | Africa | 0.2 /100 | #269 | Tragic 87.6% |
Demographics Similar to British West Indians by 1 or more Vehicles in Household
In terms of 1 or more vehicles in household, the demographic groups most similar to British West Indians are Immigrants from Guyana (70.6%, a difference of 0.31%), Immigrants from Barbados (70.6%, a difference of 0.32%), Dominican (70.7%, a difference of 0.46%), Guyanese (70.8%, a difference of 0.64%), and Inupiat (71.5%, a difference of 1.7%).
| Demographics | Rating | Rank | 1 or more Vehicles in Household |
| Immigrants | Ecuador | 0.0 /100 | #333 | Tragic 76.2% |
| Immigrants | Bangladesh | 0.0 /100 | #334 | Tragic 74.3% |
| Barbadians | 0.0 /100 | #335 | Tragic 74.0% |
| Vietnamese | 0.0 /100 | #336 | Tragic 73.8% |
| Immigrants | Uzbekistan | 0.0 /100 | #337 | Tragic 73.4% |
| Inupiat | 0.0 /100 | #338 | Tragic 71.5% |
| Guyanese | 0.0 /100 | #339 | Tragic 70.8% |
| Dominicans | 0.0 /100 | #340 | Tragic 70.7% |
| Immigrants | Barbados | 0.0 /100 | #341 | Tragic 70.6% |
| Immigrants | Guyana | 0.0 /100 | #342 | Tragic 70.6% |
| British West Indians | 0.0 /100 | #343 | Tragic 70.4% |
| Immigrants | Dominican Republic | 0.0 /100 | #344 | Tragic 68.6% |
| Immigrants | St. Vincent and the Grenadines | 0.0 /100 | #345 | Tragic 64.7% |
| Immigrants | Grenada | 0.0 /100 | #346 | Tragic 62.7% |
| Yup'ik | 0.0 /100 | #347 | Tragic 58.4% |