Immigrants from Costa Rica vs British West Indian 1 or more Vehicles in Household
COMPARE
Immigrants from Costa Rica
British West Indian
1 or more Vehicles in Household
1 or more Vehicles in Household Comparison
Immigrants from Costa Rica
British West Indians
89.8%
1 OR MORE VEHICLES IN HOUSEHOLD
57.6/ 100
METRIC RATING
170th/ 347
METRIC RANK
70.4%
1 OR MORE VEHICLES IN HOUSEHOLD
0.0/ 100
METRIC RATING
343rd/ 347
METRIC RANK
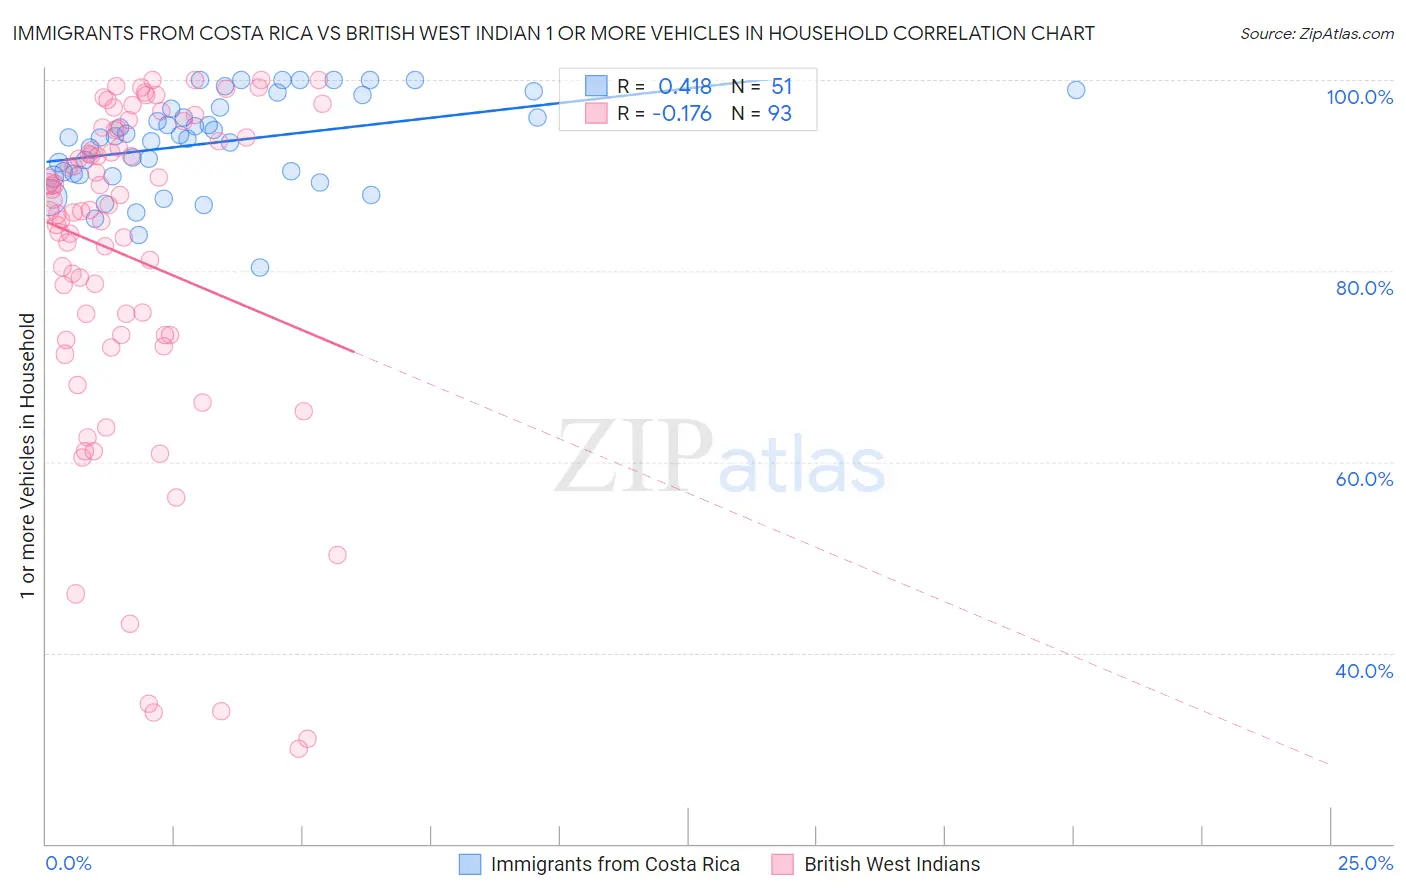
Immigrants from Costa Rica vs British West Indian 1 or more Vehicles in Household Correlation Chart
The statistical analysis conducted on geographies consisting of 204,257,602 people shows a moderate positive correlation between the proportion of Immigrants from Costa Rica and percentage of households with 1 or more vehicles available in the United States with a correlation coefficient (R) of 0.418 and weighted average of 89.8%. Similarly, the statistical analysis conducted on geographies consisting of 152,639,821 people shows a poor negative correlation between the proportion of British West Indians and percentage of households with 1 or more vehicles available in the United States with a correlation coefficient (R) of -0.176 and weighted average of 70.4%, a difference of 27.6%.
1 or more Vehicles in Household Correlation Summary
| Measurement | Immigrants from Costa Rica | British West Indian |
| Minimum | 80.3% | 30.0% |
| Maximum | 100.0% | 100.0% |
| Range | 19.7% | 70.0% |
| Mean | 93.4% | 81.5% |
| Median | 94.0% | 86.4% |
| Interquartile 25% (IQ1) | 90.0% | 73.2% |
| Interquartile 75% (IQ3) | 97.2% | 94.3% |
| Interquartile Range (IQR) | 7.2% | 21.1% |
| Standard Deviation (Sample) | 4.8% | 17.6% |
| Standard Deviation (Population) | 4.8% | 17.5% |
Similar Demographics by 1 or more Vehicles in Household
Demographics Similar to Immigrants from Costa Rica by 1 or more Vehicles in Household
In terms of 1 or more vehicles in household, the demographic groups most similar to Immigrants from Costa Rica are Native/Alaskan (89.8%, a difference of 0.030%), Immigrants from Latin America (89.8%, a difference of 0.040%), Immigrants from Cambodia (89.8%, a difference of 0.040%), French American Indian (89.8%, a difference of 0.050%), and Indonesian (89.7%, a difference of 0.070%).
| Demographics | Rating | Rank | 1 or more Vehicles in Household |
| Immigrants | Austria | 65.5 /100 | #163 | Good 89.9% |
| Comanche | 63.4 /100 | #164 | Good 89.9% |
| Immigrants | Saudi Arabia | 62.6 /100 | #165 | Good 89.9% |
| Immigrants | Middle Africa | 62.2 /100 | #166 | Good 89.9% |
| Immigrants | Latin America | 60.3 /100 | #167 | Good 89.8% |
| Immigrants | Cambodia | 60.1 /100 | #168 | Good 89.8% |
| Natives/Alaskans | 59.5 /100 | #169 | Average 89.8% |
| Immigrants | Costa Rica | 57.6 /100 | #170 | Average 89.8% |
| French American Indians | 54.4 /100 | #171 | Average 89.8% |
| Indonesians | 53.0 /100 | #172 | Average 89.7% |
| Lumbee | 52.8 /100 | #173 | Average 89.7% |
| Filipinos | 50.0 /100 | #174 | Average 89.7% |
| Immigrants | Burma/Myanmar | 47.6 /100 | #175 | Average 89.7% |
| Immigrants | Sudan | 47.1 /100 | #176 | Average 89.7% |
| Hmong | 45.8 /100 | #177 | Average 89.6% |
Demographics Similar to British West Indians by 1 or more Vehicles in Household
In terms of 1 or more vehicles in household, the demographic groups most similar to British West Indians are Immigrants from Guyana (70.6%, a difference of 0.31%), Immigrants from Barbados (70.6%, a difference of 0.32%), Dominican (70.7%, a difference of 0.46%), Guyanese (70.8%, a difference of 0.64%), and Inupiat (71.5%, a difference of 1.7%).
| Demographics | Rating | Rank | 1 or more Vehicles in Household |
| Immigrants | Ecuador | 0.0 /100 | #333 | Tragic 76.2% |
| Immigrants | Bangladesh | 0.0 /100 | #334 | Tragic 74.3% |
| Barbadians | 0.0 /100 | #335 | Tragic 74.0% |
| Vietnamese | 0.0 /100 | #336 | Tragic 73.8% |
| Immigrants | Uzbekistan | 0.0 /100 | #337 | Tragic 73.4% |
| Inupiat | 0.0 /100 | #338 | Tragic 71.5% |
| Guyanese | 0.0 /100 | #339 | Tragic 70.8% |
| Dominicans | 0.0 /100 | #340 | Tragic 70.7% |
| Immigrants | Barbados | 0.0 /100 | #341 | Tragic 70.6% |
| Immigrants | Guyana | 0.0 /100 | #342 | Tragic 70.6% |
| British West Indians | 0.0 /100 | #343 | Tragic 70.4% |
| Immigrants | Dominican Republic | 0.0 /100 | #344 | Tragic 68.6% |
| Immigrants | St. Vincent and the Grenadines | 0.0 /100 | #345 | Tragic 64.7% |
| Immigrants | Grenada | 0.0 /100 | #346 | Tragic 62.7% |
| Yup'ik | 0.0 /100 | #347 | Tragic 58.4% |