Immigrants from Bangladesh vs Korean 2 or more Vehicles in Household
COMPARE
Immigrants from Bangladesh
Korean
2 or more Vehicles in Household
2 or more Vehicles in Household Comparison
Immigrants from Bangladesh
Koreans
38.8%
2 OR MORE VEHICLES IN HOUSEHOLD
0.0/ 100
METRIC RATING
335th/ 347
METRIC RANK
61.0%
2 OR MORE VEHICLES IN HOUSEHOLD
100.0/ 100
METRIC RATING
21st/ 347
METRIC RANK
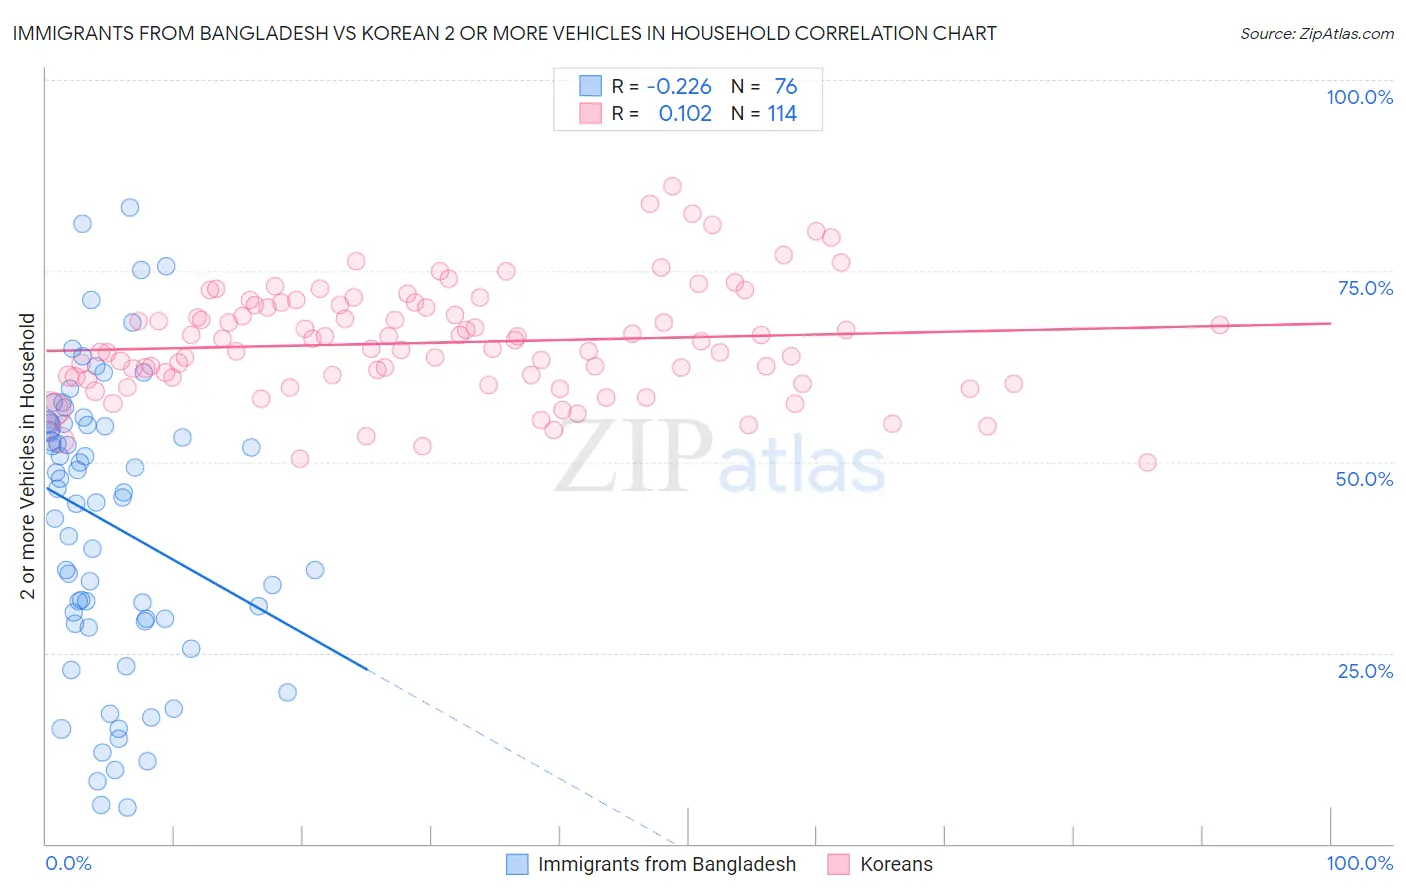
Immigrants from Bangladesh vs Korean 2 or more Vehicles in Household Correlation Chart
The statistical analysis conducted on geographies consisting of 203,599,263 people shows a weak negative correlation between the proportion of Immigrants from Bangladesh and percentage of households with 2 or more vehicles available in the United States with a correlation coefficient (R) of -0.226 and weighted average of 38.8%. Similarly, the statistical analysis conducted on geographies consisting of 510,458,267 people shows a poor positive correlation between the proportion of Koreans and percentage of households with 2 or more vehicles available in the United States with a correlation coefficient (R) of 0.102 and weighted average of 61.0%, a difference of 57.3%.
2 or more Vehicles in Household Correlation Summary
| Measurement | Immigrants from Bangladesh | Korean |
| Minimum | 4.7% | 50.0% |
| Maximum | 83.3% | 86.1% |
| Range | 78.7% | 36.1% |
| Mean | 42.0% | 65.6% |
| Median | 45.6% | 65.3% |
| Interquartile 25% (IQ1) | 29.2% | 61.0% |
| Interquartile 75% (IQ3) | 54.9% | 70.5% |
| Interquartile Range (IQR) | 25.7% | 9.5% |
| Standard Deviation (Sample) | 18.9% | 7.2% |
| Standard Deviation (Population) | 18.8% | 7.2% |
Similar Demographics by 2 or more Vehicles in Household
Demographics Similar to Immigrants from Bangladesh by 2 or more Vehicles in Household
In terms of 2 or more vehicles in household, the demographic groups most similar to Immigrants from Bangladesh are Vietnamese (38.5%, a difference of 0.72%), Barbadian (38.3%, a difference of 1.1%), Immigrants from Uzbekistan (37.9%, a difference of 2.3%), Immigrants from Trinidad and Tobago (40.3%, a difference of 3.9%), and Immigrants from Ecuador (40.5%, a difference of 4.5%).
| Demographics | Rating | Rank | 2 or more Vehicles in Household |
| Inupiat | 0.0 /100 | #328 | Tragic 42.6% |
| Ecuadorians | 0.0 /100 | #329 | Tragic 42.0% |
| Immigrants | Dominica | 0.0 /100 | #330 | Tragic 41.6% |
| West Indians | 0.0 /100 | #331 | Tragic 41.3% |
| Trinidadians and Tobagonians | 0.0 /100 | #332 | Tragic 40.9% |
| Immigrants | Ecuador | 0.0 /100 | #333 | Tragic 40.5% |
| Immigrants | Trinidad and Tobago | 0.0 /100 | #334 | Tragic 40.3% |
| Immigrants | Bangladesh | 0.0 /100 | #335 | Tragic 38.8% |
| Vietnamese | 0.0 /100 | #336 | Tragic 38.5% |
| Barbadians | 0.0 /100 | #337 | Tragic 38.3% |
| Immigrants | Uzbekistan | 0.0 /100 | #338 | Tragic 37.9% |
| Immigrants | Barbados | 0.0 /100 | #339 | Tragic 35.8% |
| British West Indians | 0.0 /100 | #340 | Tragic 35.4% |
| Guyanese | 0.0 /100 | #341 | Tragic 35.4% |
| Dominicans | 0.0 /100 | #342 | Tragic 35.3% |
Demographics Similar to Koreans by 2 or more Vehicles in Household
In terms of 2 or more vehicles in household, the demographic groups most similar to Koreans are Sri Lankan (61.0%, a difference of 0.040%), Swiss (61.0%, a difference of 0.040%), Scotch-Irish (60.9%, a difference of 0.070%), Immigrants from Vietnam (60.9%, a difference of 0.11%), and White/Caucasian (60.8%, a difference of 0.26%).
| Demographics | Rating | Rank | 2 or more Vehicles in Household |
| Czechs | 100.0 /100 | #14 | Exceptional 61.5% |
| Nepalese | 100.0 /100 | #15 | Exceptional 61.4% |
| Native Hawaiians | 100.0 /100 | #16 | Exceptional 61.4% |
| Basques | 100.0 /100 | #17 | Exceptional 61.4% |
| Europeans | 100.0 /100 | #18 | Exceptional 61.4% |
| Scottish | 100.0 /100 | #19 | Exceptional 61.2% |
| Sri Lankans | 100.0 /100 | #20 | Exceptional 61.0% |
| Koreans | 100.0 /100 | #21 | Exceptional 61.0% |
| Swiss | 100.0 /100 | #22 | Exceptional 61.0% |
| Scotch-Irish | 100.0 /100 | #23 | Exceptional 60.9% |
| Immigrants | Vietnam | 100.0 /100 | #24 | Exceptional 60.9% |
| Whites/Caucasians | 100.0 /100 | #25 | Exceptional 60.8% |
| Welsh | 100.0 /100 | #26 | Exceptional 60.8% |
| Assyrians/Chaldeans/Syriacs | 100.0 /100 | #27 | Exceptional 60.5% |
| Guamanians/Chamorros | 100.0 /100 | #28 | Exceptional 60.5% |