Immigrants from Bangladesh vs Latvian No Schooling Completed
COMPARE
Immigrants from Bangladesh
Latvian
No Schooling Completed
No Schooling Completed Comparison
Immigrants from Bangladesh
Latvians
3.1%
NO SCHOOLING COMPLETED
0.0/ 100
METRIC RATING
320th/ 347
METRIC RANK
1.5%
NO SCHOOLING COMPLETED
100.0/ 100
METRIC RATING
34th/ 347
METRIC RANK
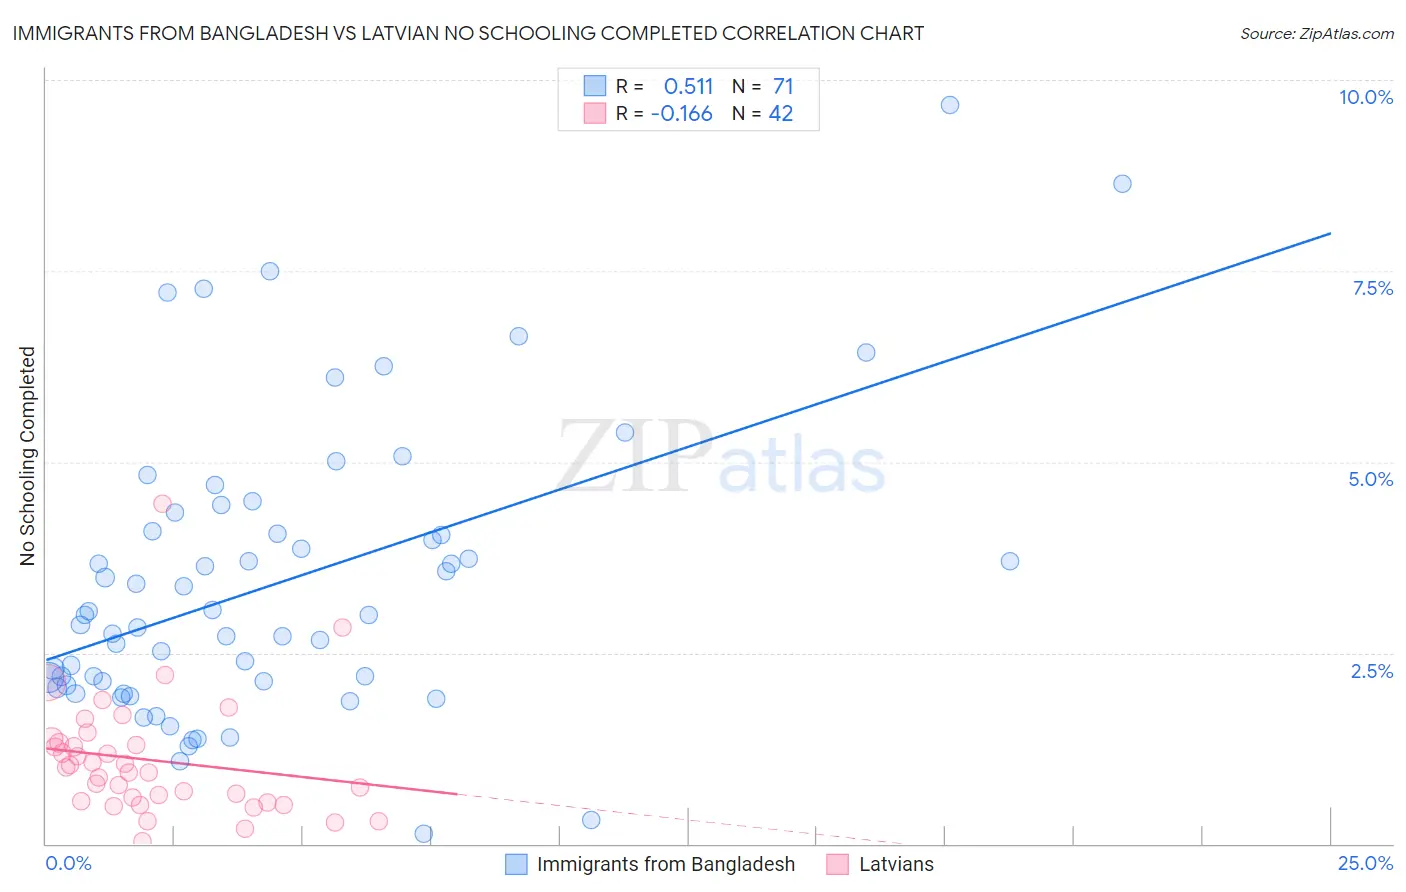
Immigrants from Bangladesh vs Latvian No Schooling Completed Correlation Chart
The statistical analysis conducted on geographies consisting of 203,165,011 people shows a substantial positive correlation between the proportion of Immigrants from Bangladesh and percentage of population with no schooling in the United States with a correlation coefficient (R) of 0.511 and weighted average of 3.1%. Similarly, the statistical analysis conducted on geographies consisting of 219,073,605 people shows a poor negative correlation between the proportion of Latvians and percentage of population with no schooling in the United States with a correlation coefficient (R) of -0.166 and weighted average of 1.5%, a difference of 104.0%.
No Schooling Completed Correlation Summary
| Measurement | Immigrants from Bangladesh | Latvian |
| Minimum | 0.13% | 0.028% |
| Maximum | 9.7% | 4.5% |
| Range | 9.6% | 4.4% |
| Mean | 3.4% | 1.1% |
| Median | 3.0% | 0.97% |
| Interquartile 25% (IQ1) | 2.1% | 0.56% |
| Interquartile 75% (IQ3) | 4.1% | 1.3% |
| Interquartile Range (IQR) | 2.0% | 0.76% |
| Standard Deviation (Sample) | 1.9% | 0.80% |
| Standard Deviation (Population) | 1.9% | 0.79% |
Similar Demographics by No Schooling Completed
Demographics Similar to Immigrants from Bangladesh by No Schooling Completed
In terms of no schooling completed, the demographic groups most similar to Immigrants from Bangladesh are Immigrants from Burma/Myanmar (3.1%, a difference of 0.040%), Immigrants from Laos (3.1%, a difference of 0.11%), Immigrants from Guyana (3.1%, a difference of 0.78%), Immigrants from Honduras (3.2%, a difference of 0.79%), and Vietnamese (3.2%, a difference of 0.98%).
| Demographics | Rating | Rank | No Schooling Completed |
| Hondurans | 0.0 /100 | #313 | Tragic 3.1% |
| Immigrants | Belize | 0.0 /100 | #314 | Tragic 3.1% |
| Immigrants | Nicaragua | 0.0 /100 | #315 | Tragic 3.1% |
| Immigrants | Ecuador | 0.0 /100 | #316 | Tragic 3.1% |
| Cape Verdeans | 0.0 /100 | #317 | Tragic 3.1% |
| Immigrants | Guyana | 0.0 /100 | #318 | Tragic 3.1% |
| Immigrants | Burma/Myanmar | 0.0 /100 | #319 | Tragic 3.1% |
| Immigrants | Bangladesh | 0.0 /100 | #320 | Tragic 3.1% |
| Immigrants | Laos | 0.0 /100 | #321 | Tragic 3.1% |
| Immigrants | Honduras | 0.0 /100 | #322 | Tragic 3.2% |
| Vietnamese | 0.0 /100 | #323 | Tragic 3.2% |
| Mexican American Indians | 0.0 /100 | #324 | Tragic 3.2% |
| Dominicans | 0.0 /100 | #325 | Tragic 3.2% |
| Indonesians | 0.0 /100 | #326 | Tragic 3.2% |
| Immigrants | Latin America | 0.0 /100 | #327 | Tragic 3.3% |
Demographics Similar to Latvians by No Schooling Completed
In terms of no schooling completed, the demographic groups most similar to Latvians are Italian (1.5%, a difference of 0.25%), Swiss (1.5%, a difference of 0.94%), Eastern European (1.6%, a difference of 0.95%), Inupiat (1.5%, a difference of 1.3%), and British (1.5%, a difference of 1.4%).
| Demographics | Rating | Rank | No Schooling Completed |
| Scandinavians | 100.0 /100 | #27 | Exceptional 1.5% |
| French Canadians | 100.0 /100 | #28 | Exceptional 1.5% |
| Lumbee | 100.0 /100 | #29 | Exceptional 1.5% |
| British | 100.0 /100 | #30 | Exceptional 1.5% |
| Inupiat | 100.0 /100 | #31 | Exceptional 1.5% |
| Swiss | 100.0 /100 | #32 | Exceptional 1.5% |
| Italians | 100.0 /100 | #33 | Exceptional 1.5% |
| Latvians | 100.0 /100 | #34 | Exceptional 1.5% |
| Eastern Europeans | 100.0 /100 | #35 | Exceptional 1.6% |
| Aleuts | 99.9 /100 | #36 | Exceptional 1.6% |
| Belgians | 99.9 /100 | #37 | Exceptional 1.6% |
| Northern Europeans | 99.9 /100 | #38 | Exceptional 1.6% |
| Native Hawaiians | 99.9 /100 | #39 | Exceptional 1.6% |
| Luxembourgers | 99.9 /100 | #40 | Exceptional 1.6% |
| Hungarians | 99.9 /100 | #41 | Exceptional 1.6% |