Immigrants from Afghanistan vs Immigrants from Indonesia Householder Income Ages 45 - 64 years
COMPARE
Immigrants from Afghanistan
Immigrants from Indonesia
Householder Income Ages 45 - 64 years
Householder Income Ages 45 - 64 years Comparison
Immigrants from Afghanistan
Immigrants from Indonesia
$108,785
HOUSEHOLDER INCOME AGES 45 - 64 YEARS
98.6/ 100
METRIC RATING
85th/ 347
METRIC RANK
$113,519
HOUSEHOLDER INCOME AGES 45 - 64 YEARS
99.9/ 100
METRIC RATING
48th/ 347
METRIC RANK
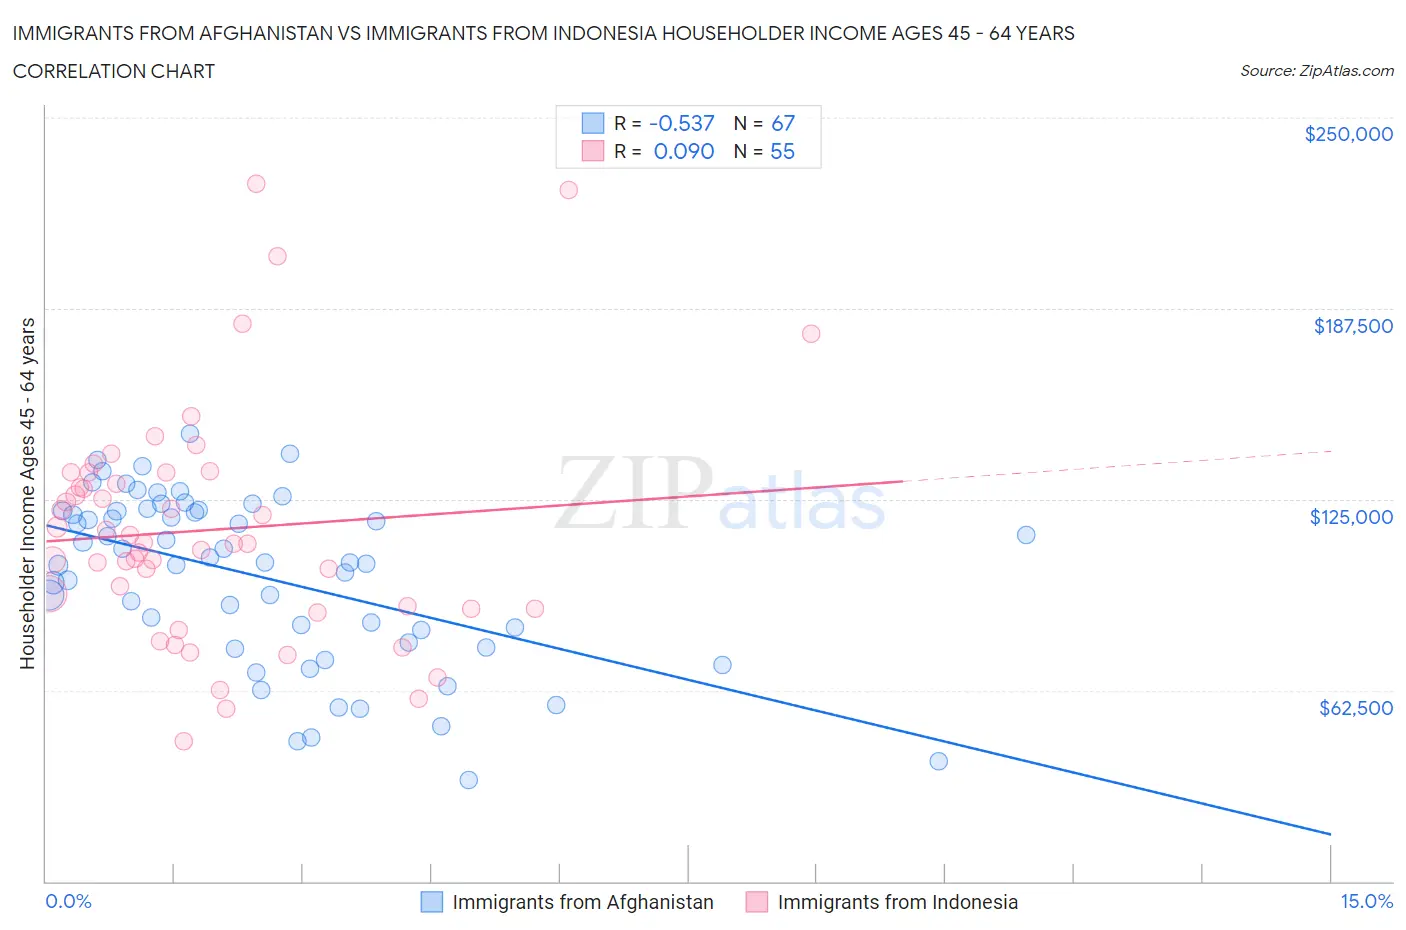
Immigrants from Afghanistan vs Immigrants from Indonesia Householder Income Ages 45 - 64 years Correlation Chart
The statistical analysis conducted on geographies consisting of 147,616,456 people shows a substantial negative correlation between the proportion of Immigrants from Afghanistan and household income with householder between the ages 45 and 64 in the United States with a correlation coefficient (R) of -0.537 and weighted average of $108,785. Similarly, the statistical analysis conducted on geographies consisting of 215,592,111 people shows a slight positive correlation between the proportion of Immigrants from Indonesia and household income with householder between the ages 45 and 64 in the United States with a correlation coefficient (R) of 0.090 and weighted average of $113,519, a difference of 4.3%.
Householder Income Ages 45 - 64 years Correlation Summary
| Measurement | Immigrants from Afghanistan | Immigrants from Indonesia |
| Minimum | $33,125 | $45,964 |
| Maximum | $146,322 | $228,214 |
| Range | $113,197 | $182,250 |
| Mean | $99,596 | $114,986 |
| Median | $104,498 | $110,532 |
| Interquartile 25% (IQ1) | $78,229 | $89,063 |
| Interquartile 75% (IQ3) | $121,219 | $133,651 |
| Interquartile Range (IQR) | $42,990 | $44,588 |
| Standard Deviation (Sample) | $27,771 | $37,980 |
| Standard Deviation (Population) | $27,563 | $37,633 |
Similar Demographics by Householder Income Ages 45 - 64 years
Demographics Similar to Immigrants from Afghanistan by Householder Income Ages 45 - 64 years
In terms of householder income ages 45 - 64 years, the demographic groups most similar to Immigrants from Afghanistan are Immigrants from Western Europe ($108,824, a difference of 0.040%), Austrian ($108,692, a difference of 0.090%), Tongan ($108,643, a difference of 0.13%), Romanian ($108,609, a difference of 0.16%), and Immigrants from Spain ($109,051, a difference of 0.24%).
| Demographics | Rating | Rank | Householder Income Ages 45 - 64 years |
| Immigrants | Canada | 99.0 /100 | #78 | Exceptional $109,402 |
| Immigrants | Bulgaria | 98.9 /100 | #79 | Exceptional $109,379 |
| Jordanians | 98.9 /100 | #80 | Exceptional $109,376 |
| Immigrants | Eastern Europe | 98.9 /100 | #81 | Exceptional $109,335 |
| Immigrants | North America | 98.8 /100 | #82 | Exceptional $109,198 |
| Immigrants | Spain | 98.8 /100 | #83 | Exceptional $109,051 |
| Immigrants | Western Europe | 98.6 /100 | #84 | Exceptional $108,824 |
| Immigrants | Afghanistan | 98.6 /100 | #85 | Exceptional $108,785 |
| Austrians | 98.5 /100 | #86 | Exceptional $108,692 |
| Tongans | 98.5 /100 | #87 | Exceptional $108,643 |
| Romanians | 98.5 /100 | #88 | Exceptional $108,609 |
| Ukrainians | 98.3 /100 | #89 | Exceptional $108,475 |
| Immigrants | Philippines | 98.3 /100 | #90 | Exceptional $108,471 |
| Immigrants | Lebanon | 98.3 /100 | #91 | Exceptional $108,471 |
| Croatians | 98.3 /100 | #92 | Exceptional $108,383 |
Demographics Similar to Immigrants from Indonesia by Householder Income Ages 45 - 64 years
In terms of householder income ages 45 - 64 years, the demographic groups most similar to Immigrants from Indonesia are Australian ($113,533, a difference of 0.010%), Immigrants from Greece ($113,548, a difference of 0.030%), Immigrants from France ($113,680, a difference of 0.14%), Immigrants from Russia ($113,215, a difference of 0.27%), and Bulgarian ($113,883, a difference of 0.32%).
| Demographics | Rating | Rank | Householder Income Ages 45 - 64 years |
| Immigrants | Lithuania | 99.9 /100 | #41 | Exceptional $114,336 |
| Estonians | 99.9 /100 | #42 | Exceptional $114,220 |
| Israelis | 99.9 /100 | #43 | Exceptional $114,186 |
| Bulgarians | 99.9 /100 | #44 | Exceptional $113,883 |
| Immigrants | France | 99.9 /100 | #45 | Exceptional $113,680 |
| Immigrants | Greece | 99.9 /100 | #46 | Exceptional $113,548 |
| Australians | 99.9 /100 | #47 | Exceptional $113,533 |
| Immigrants | Indonesia | 99.9 /100 | #48 | Exceptional $113,519 |
| Immigrants | Russia | 99.8 /100 | #49 | Exceptional $113,215 |
| Immigrants | Austria | 99.8 /100 | #50 | Exceptional $113,140 |
| Immigrants | South Africa | 99.8 /100 | #51 | Exceptional $112,886 |
| Immigrants | Malaysia | 99.8 /100 | #52 | Exceptional $112,796 |
| Afghans | 99.8 /100 | #53 | Exceptional $112,676 |
| Greeks | 99.8 /100 | #54 | Exceptional $112,630 |
| Lithuanians | 99.8 /100 | #55 | Exceptional $112,484 |